This model tracks the intraday system I share with other traders, with performance statistics updated daily.
It is based on the “Deep Dive: Day Trading Volatility Breakouts Systematically [All Rules Included]” methodology. For this final version — the one I personally trade live — I introduced a small refinement.
I have traded this model live since May 2023. You can also review my X feed, where I have posted comments and observations about this system over time.
The statistics below are updated daily and reflect a continuous backtest with IBKR fees included. These results are based on ETFs, which I personally use because they offer more precise position-sizing flexibility. From a capital-efficiency perspective, however, trading the system with futures or micro futures is often the more practical choice (see below).
Equity Curve for the Intraday Volatility Breakout System
Detailed Statistics (Updated Daily)
The system trades three markets. The long statistics are cumulative across all long trades in all three markets, while the short statistics are cumulative across all short trades. The combined statistics reflect the results of all trades together.
Statistics are based on $20,000 in trading capital, with no compounding and a risk of $200 per trade (maximum of 3 trades per day). IBKR fees are included.
| Long | Short | Combined | |
|---|---|---|---|
| NetProfit | $8,068 | $13,505 | $21,573 |
| ROR | 7.82% | 13.30% | 20.91% |
| MaxDD | -15.20% | -12.18% | -15.65% |
| Trades | 289 | 348 | 637 |
| PctWins | 51.21% | 50.57% | 50.86% |
| AvgWin | 0.85% | 1.06% | 0.96% |
| AvgLoss | 0.71% | 0.62% | 0.66% |
| Expectancy | 0.09% | 0.23% | 0.16% |
| ProfitFactor | 1.55 | 1.54 | 1.54 |
| Sharpe | 0.93 | 0.82 | 1.15 |
Last update: 03-12-2026
Monthly Combined Statistics
| YEAR | Jan | Feb | Mar | Apr | May | Jun | Jul | Aug | Sep | Oct | Nov | Dec | TOTAL | MaxDD |
|---|---|---|---|---|---|---|---|---|---|---|---|---|---|---|
| 2021 | 2.3% | -0.3% | 2.8% | 2.2% | -1.2% | 2.5% | 0.4% | 0.5% | 0.3% | 1.8% | 0.9% | -0.3% | 12.0% | -2.0% |
| 2022 | 1.9% | 4.4% | 5.6% | -0.1% | -2.6% | -0.1% | 4.8% | 2.4% | -4.0% | 1.2% | -0.8% | 2.4% | 15.2% | -7.5% |
| 2023 | 0.9% | 4.0% | -0.4% | 2.0% | 4.2% | 2.9% | 1.2% | -2.1% | 3.6% | -3.0% | 0.2% | 3.2% | 16.7% | -4.5% |
| 2024 | 0.3% | -0.5% | 0.9% | 14.3% | 0.7% | 0.6% | -1.1% | 12.0% | -7.5% | -0.5% | -2.4% | 5.1% | 22.0% | -14.3% |
| 2025 | -7.4% | 13.4% | -0.7% | 3.2% | -2.6% | -3.4% | 4.6% | 7.0% | -2.5% | 0.6% | 24.5% | 3.1% | 39.7% | -14.8% |
| 2026 | -0.7% | 4.1% | -1.2% | NaN | NaN | NaN | NaN | NaN | NaN | NaN | NaN | NaN | 2.2% | -1.8% |
| AVG | -0.4% | 4.2% | 1.2% | 4.3% | -0.3% | 0.5% | 2.0% | 3.9% | -2.0% | 0.0% | 4.5% | 2.7% | 18.0% | -7.5% |
I have been trading this model live since May 2023.
Trading with Micro Futures (for Capital Efficiency)
The realistic minimum capital for this system is $15,000–$20,000. It can also be traded with less capital, but in that case only one market is typically traded, such as Micro Nasdaq futures.
The equity curve below reflects a backtest from January 1, 2024 to March 1, 2026, using micro futures, $20,000 in capital, and $200 risk per trade. Fees are included. The results are very close to those achieved with ETFs. The main difference is less precise position sizing — with micro futures and smaller capital, trading is usually limited to one or two contracts.
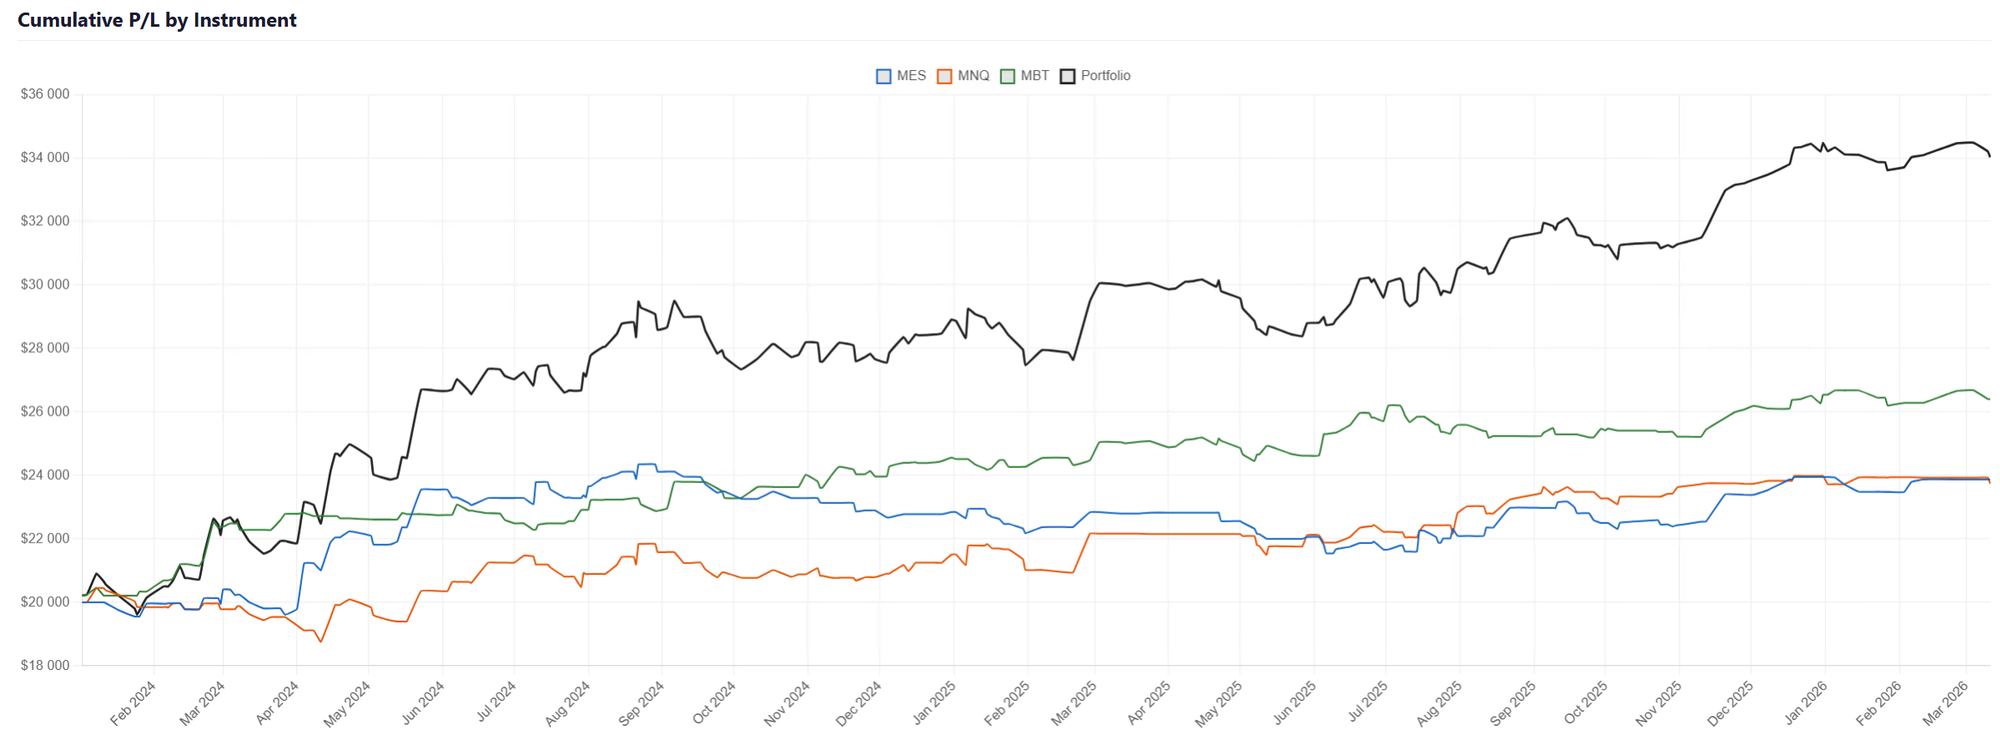
Capital Efficiency
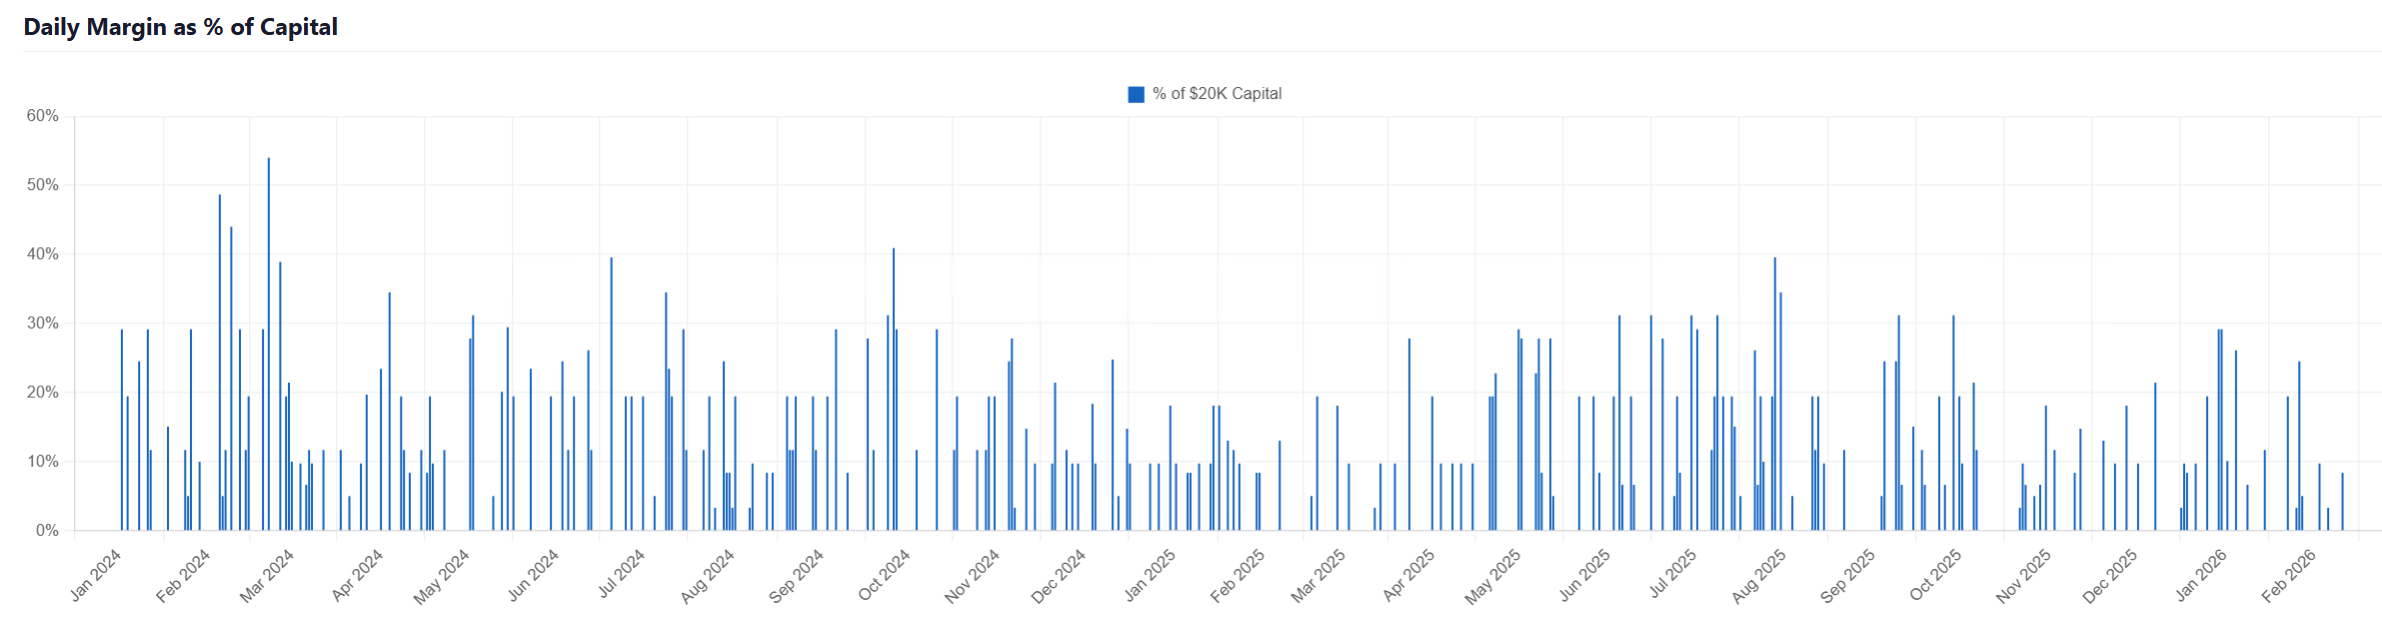
The system integrates well with other strategies in a portfolio. Even with currently elevated intraday futures margin requirements (TradeStation values: MES $667, MNQ $1,012, MBT $1,947), the average capital allocated to margin across all tested trading days is only 16.5%.
The chart below shows the daily margin usage as a percentage of total portfolio capital in more detail.
This means the intraday breakout system can be run efficiently alongside, for example, a swing stock portfolio.
Implementation Code + Bot Trading Tools
As this strategy has sufficient capacity, I share my exact trading logic, including the open code and my bot trading tools.
This is offered for a fee, as I have invested significant time in researching this topic and building these tools. However, even for a smaller account, such as $20,000, the fee may be recovered relatively quickly. That said, no guarantees can be made, and the entire framework is provided for educational purposes only.
Get the exact intraday system I trade with my own capital:

