
Holding a position mechanically in the direction of the breakout—even for just a few hours after a swing is breached—proves to be a statistically much more interesting edge for building a robust trading system.
Trend trading is one of the safest methods in trading. But where do you board the moving train? One of the potentially strongest areas is the breakout of a swing high/low—places where a significant shift in supply and demand has historically occurred.
1. What Is a Swing and Why Does It Matter?
On the chart below, you can see a 120-minute timeframe of the Gold futures contract (GC) with swings marked. Blue points indicate a swing high (local peaks), and red points indicate a swing low (local bottoms).
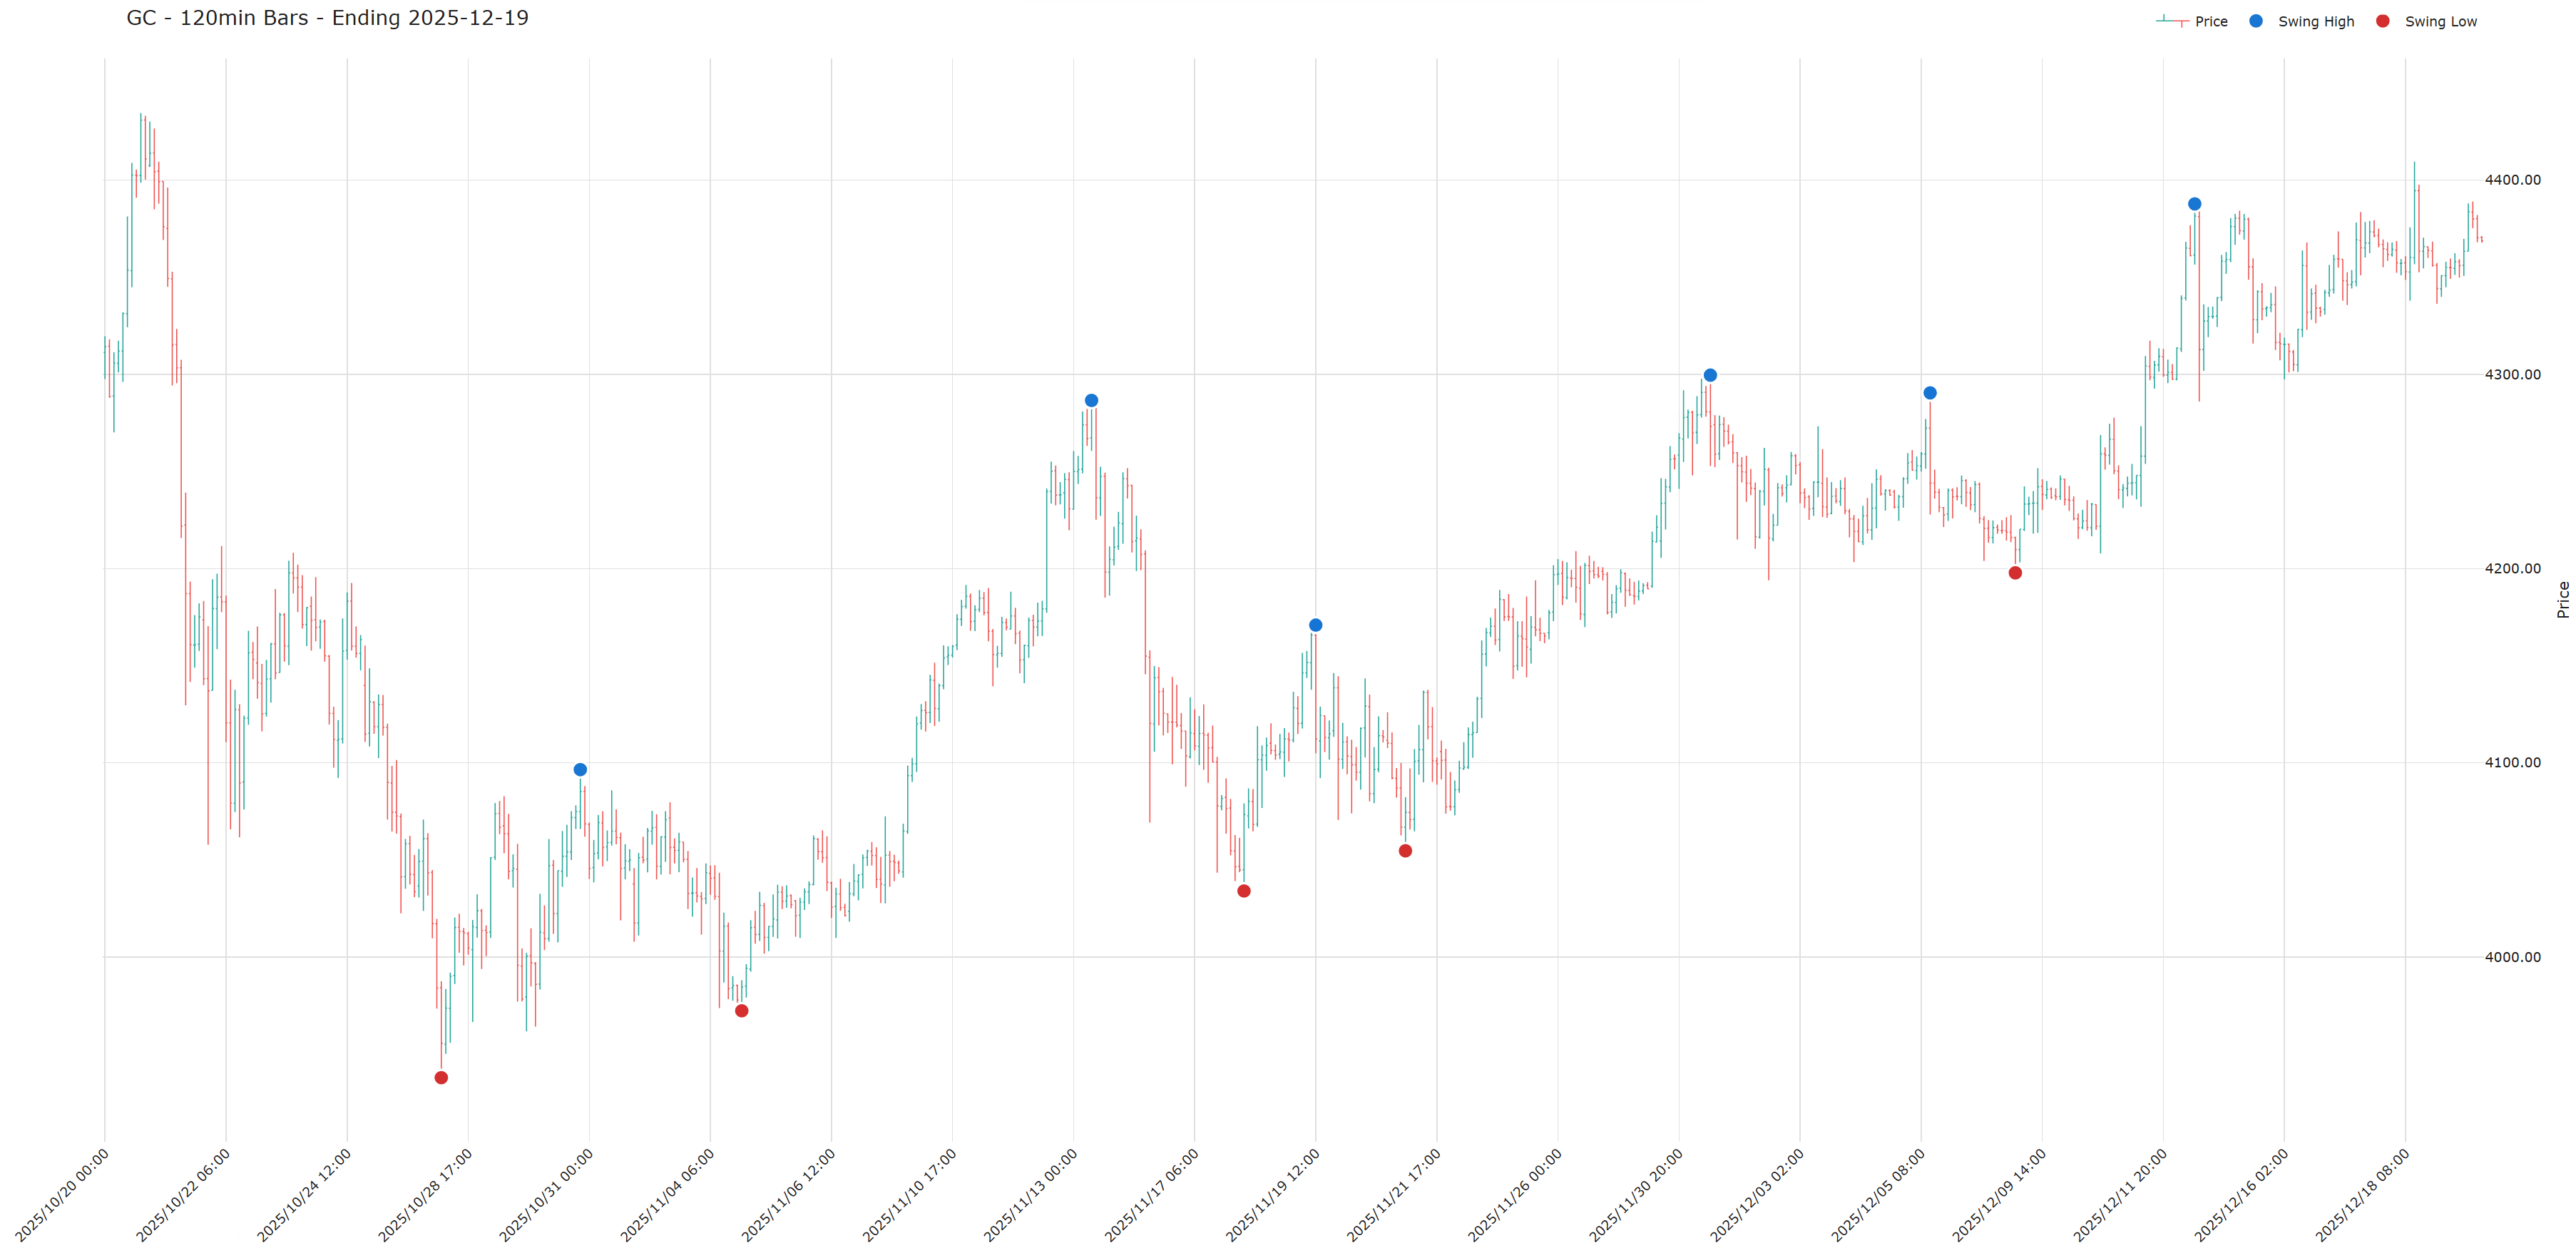
Marking these swings gives us an immediate navigational map. Price didn't turn at these points by accident. Behind every such point was a temporary shift in the balance of power between buyers and sellers. The market "remembers" these levels.
Why are swings so important? Imagine a swing high as a place where the last group of buyers suffered pain when the market turned against them. At the same time, it is the place where bears (short sellers) place their stop-losses to protect profits.
When price returns to this level and breaks through it, two things happen simultaneously:
1. Short sellers panic, and their stop-losses (buy orders) are triggered.
2. Breakout traders see that the price isn't holding this time and start jumping in long.
This combination can create "fuel" for a sharp move in the direction of the breakout.
How to Define a Swing for Algorithmic Testing
Before we start testing, we must define swings precisely. A subjective "eyeball" view isn't enough for backtesting. There are many methods:
- Fractals (Bill Williams): A swing high is a bar with the highest High, surrounded by N bars with lower Highs.
- Percentage Retracement: A swing is formed if the market retraces by X%.
- ATR Movement: A swing must be of a minimum size measured in multiples of the Average True Range (ATR).
For this research, I focused on more significant swings—those that appear roughly once a day or less. I used a volatility-based definition (1× daily ATR) with a small additional filter. If you apply simple ATR logic, your swing structure—and thus your test results—should be very similar to mine. I won't reveal the exact script definition, as I plan to build a proprietary system on this concept.
2. Test Methodology: Seeking Pure Probability
The goal of this research is not to show a finished strategy, but to determine the fundamental market tendency. Does the market tend to bounce (Mean Reversion) or break through (Breakout) after touching a significant swing? To get "pure data," the tests are performed without commissions and without slippage.
Test Parameters
- Data: Continuous, back-adjusted 1-minute data from TradeStation.
- Scope: 40 futures markets (US indices, commodities, bonds + DAX).
- History: From 2003 (most markets from 2006) to the present.
- Entry: Stop order exactly at the swing price. Each swing is traded only once.
- Money Management: Volatility Normalization. I open a number of contracts corresponding to a $25,000 movement based on average daily volatility.
- Note: This is not a recommended risk for a real account! It is a mathematical method to ensure that cheap corn has the same weight in the test as an expensive stock index.
- Exit: Time-based. We test what happens after X hourly bars. No other Stop-Loss or Profit-Target.
3. Test Results: The Myth of Reversals Crumbles
Let's look at the hard data. I tested various position holding times.
A) Holding 1 Hour After Breakout (Immediate Reaction)
In this scenario, we enter upon touching the swing and exit at the Close of the following 60-minute bar. Here is a visual example of a trade on Crude Oil (CL), which happened to end in a loss (false breakout):

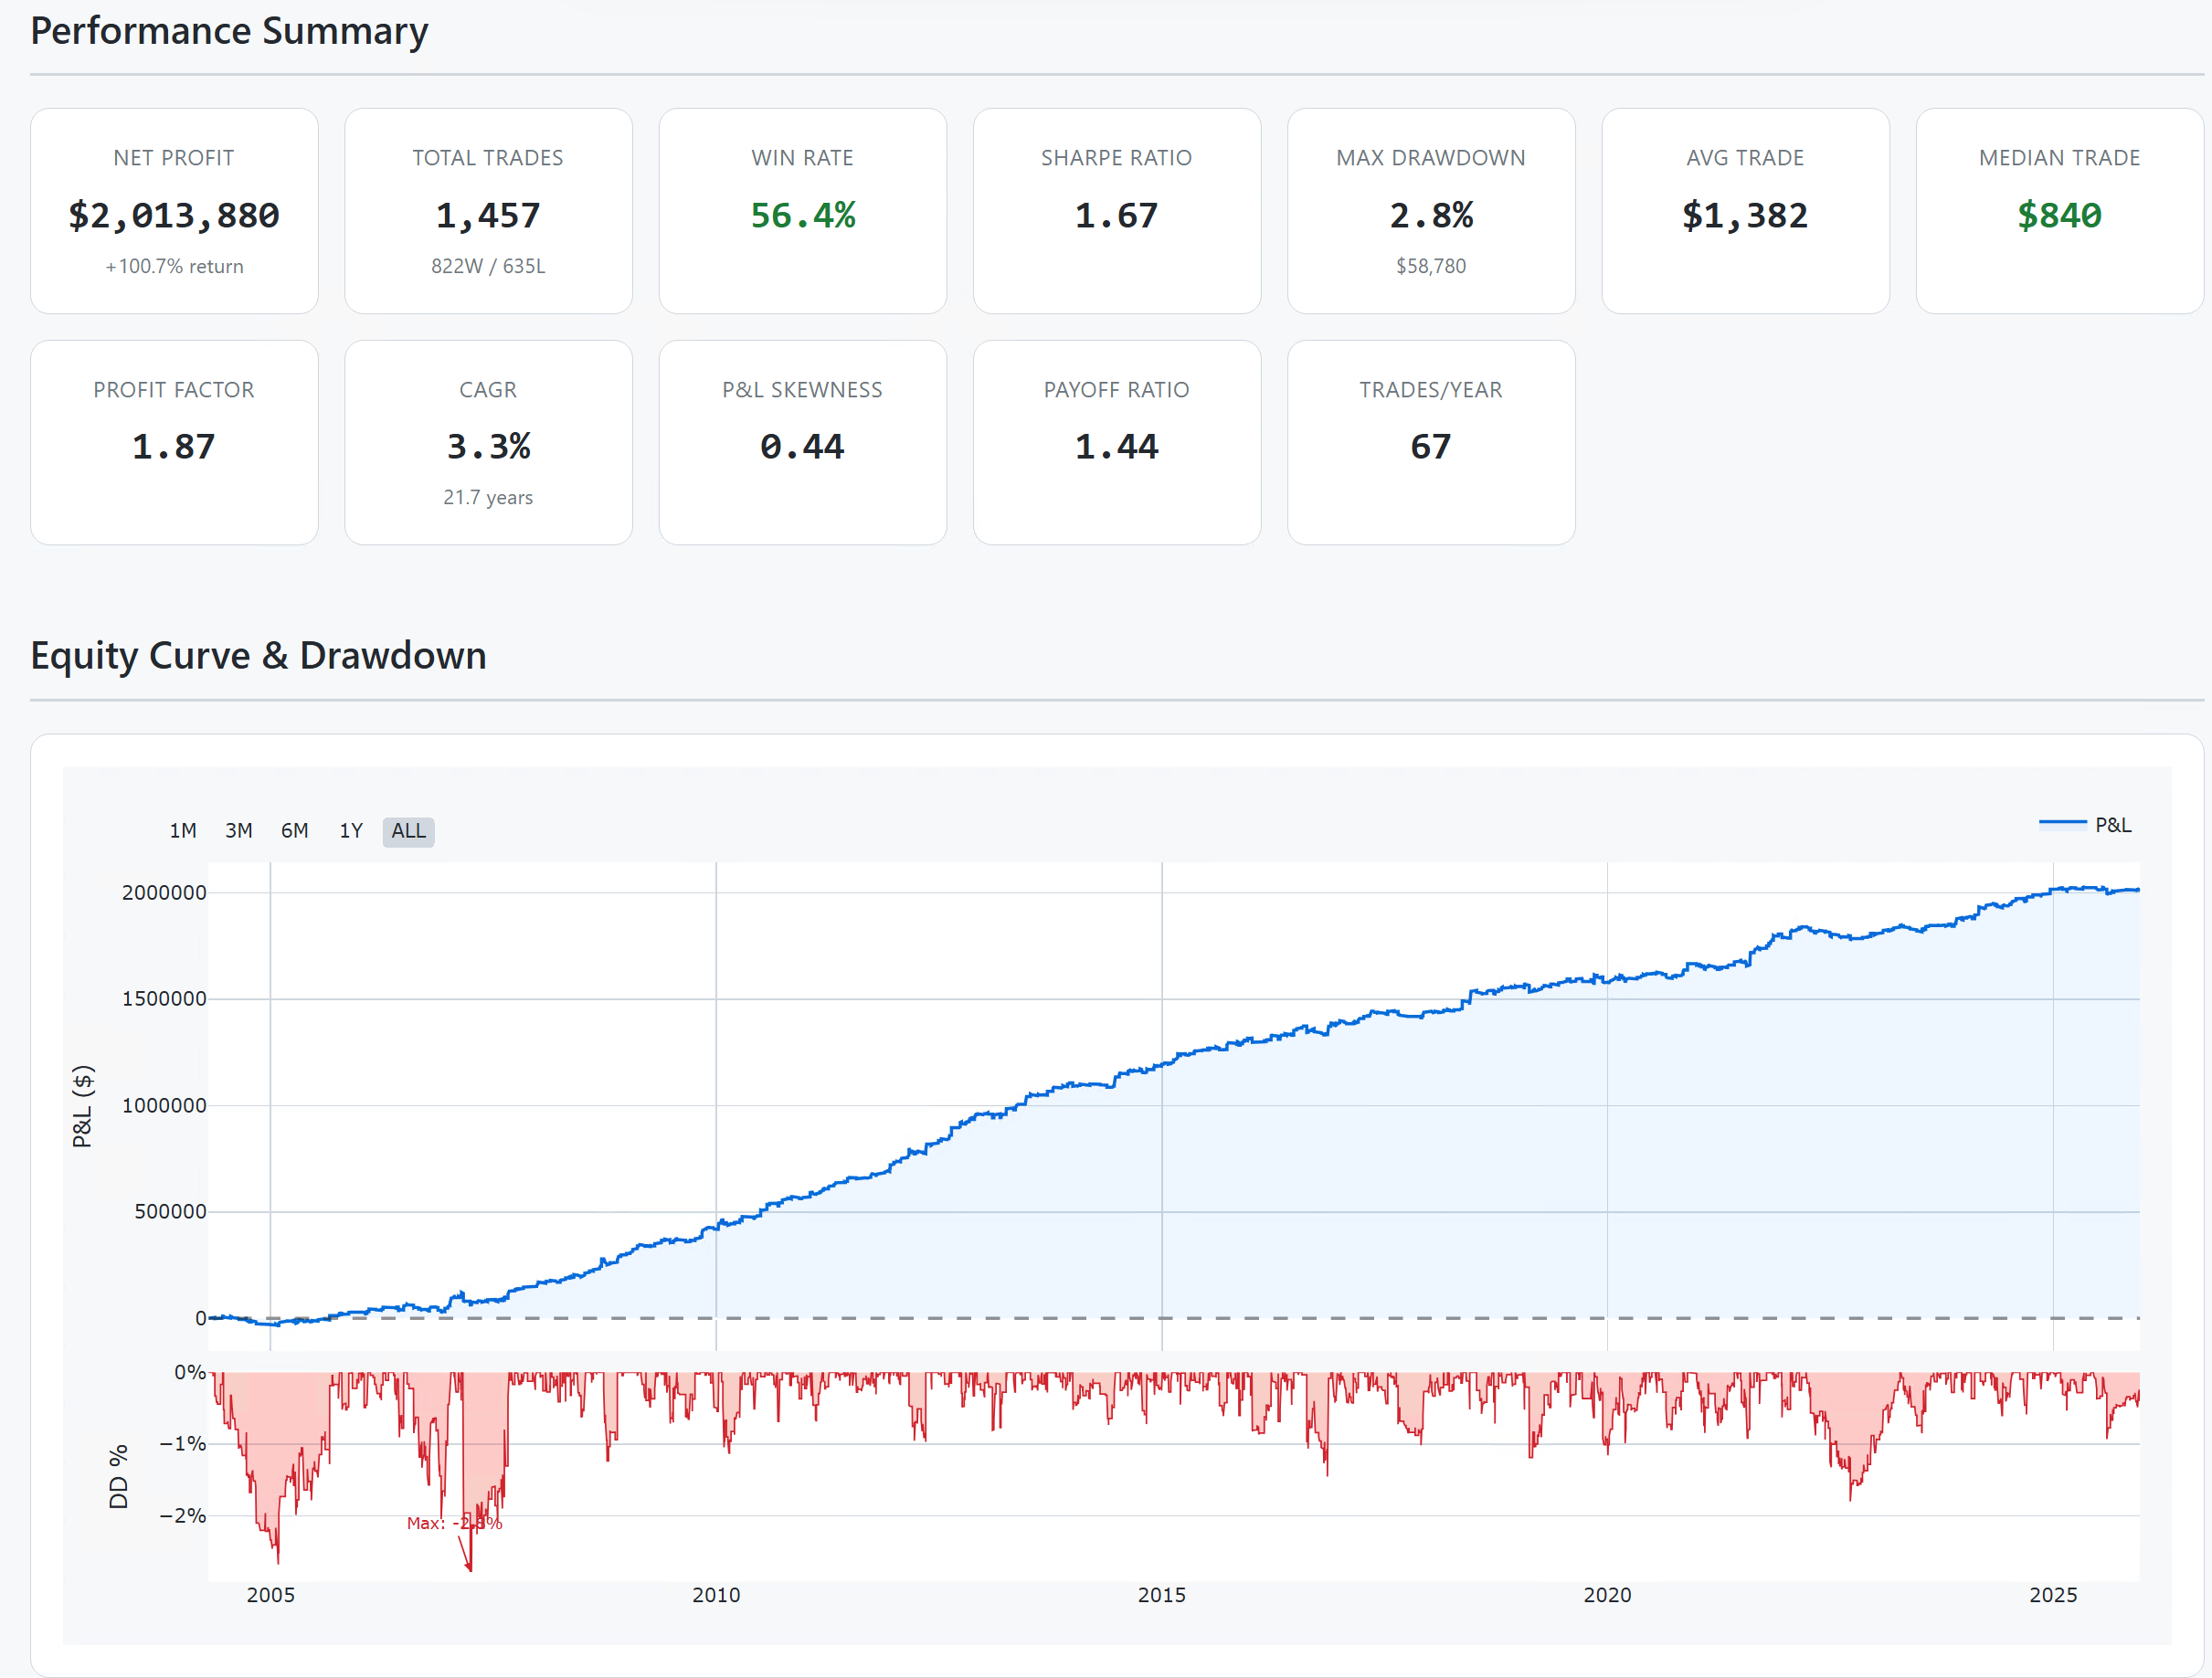
Although the example above didn't work out, statistics from over 40,000 trades speak clearly in favor of breakouts. If you had mechanically bought swing highs and sold swing lows on all 40 markets with a 1-hour exit, your theoretical equity curve would look like this:
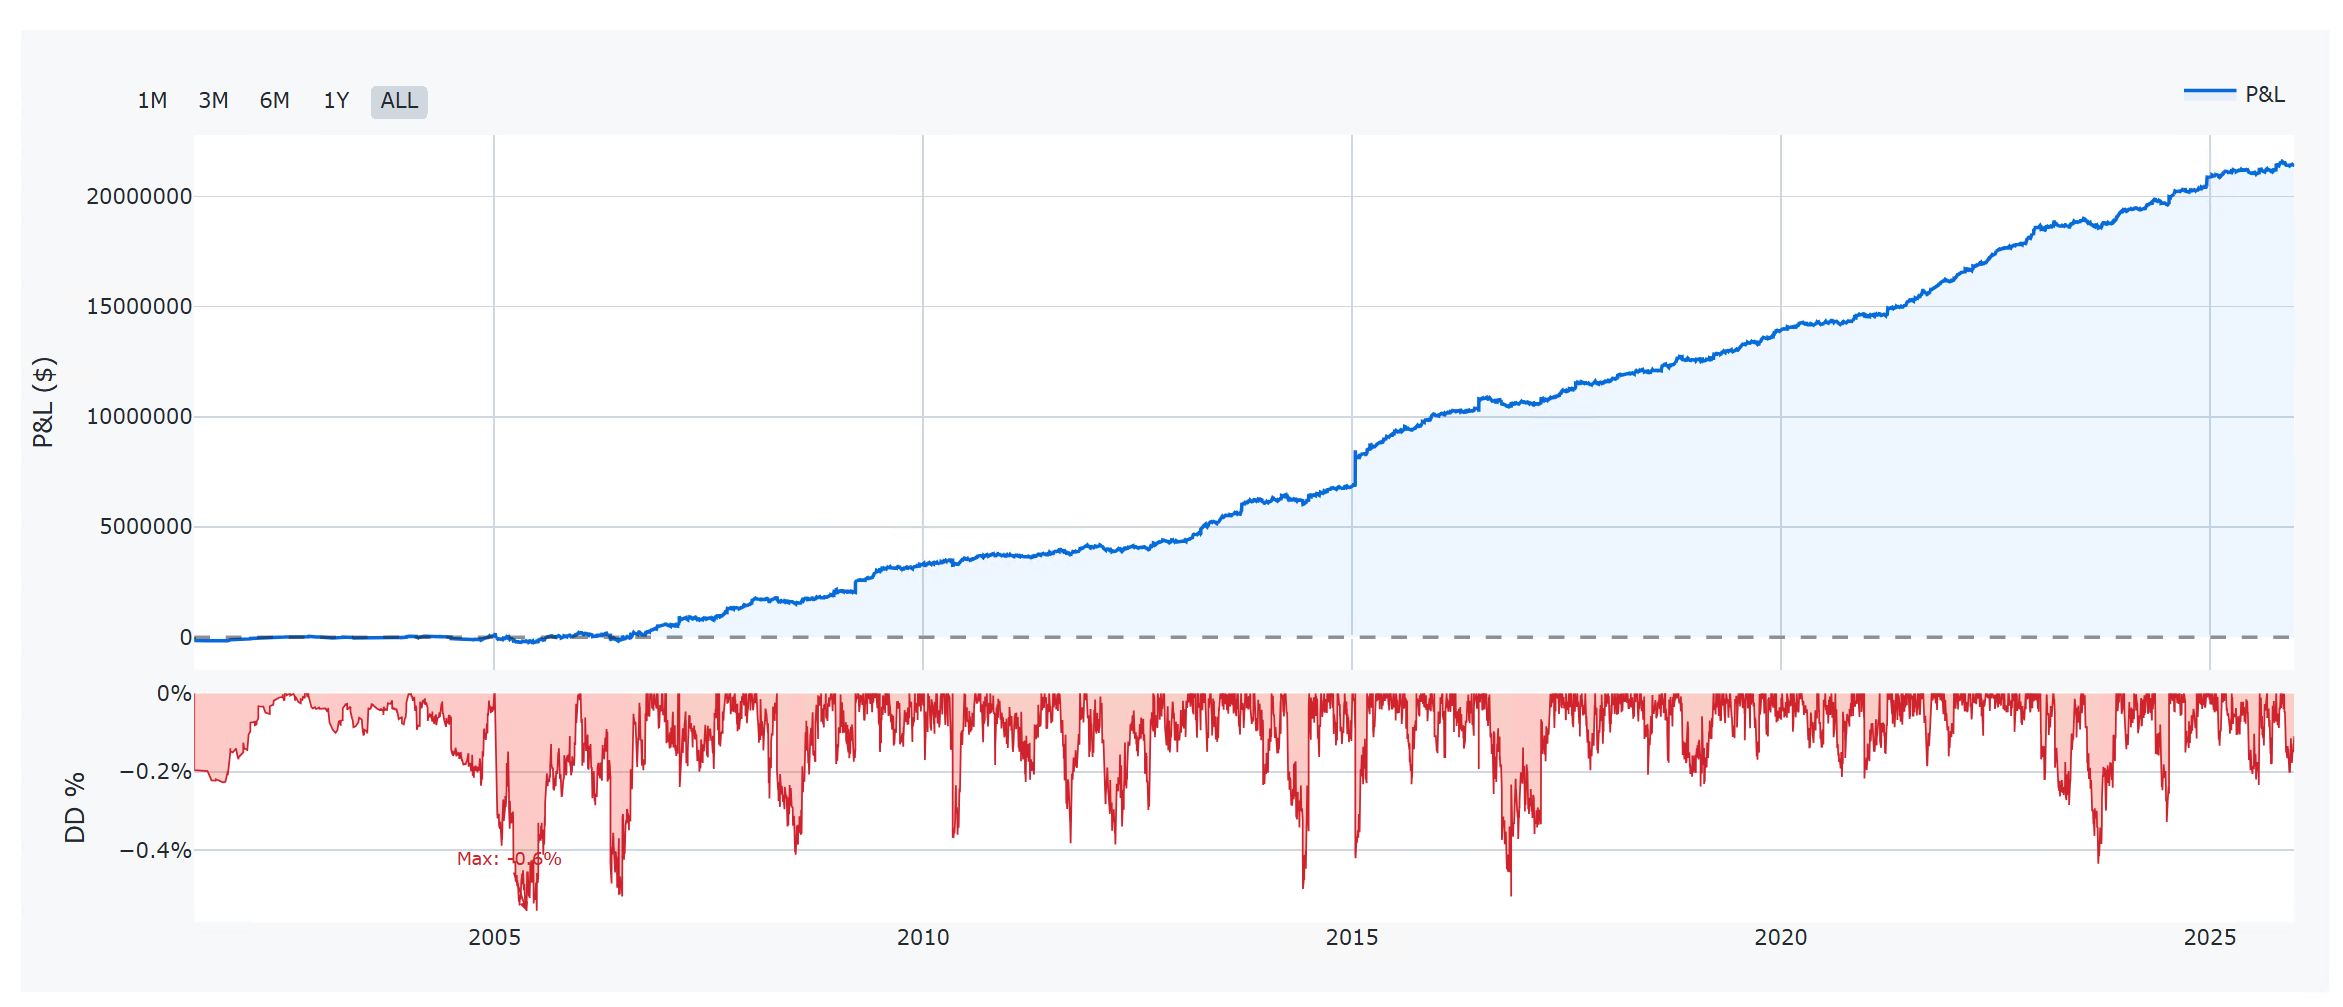
Key Findings:
- Sharpe Ratio 1.59: This is a very solid number for a "raw" system without filters and SL. Though let's not forget commissions and slippage are excluded.
- Consistency: The system has worked stably for over 25 years.
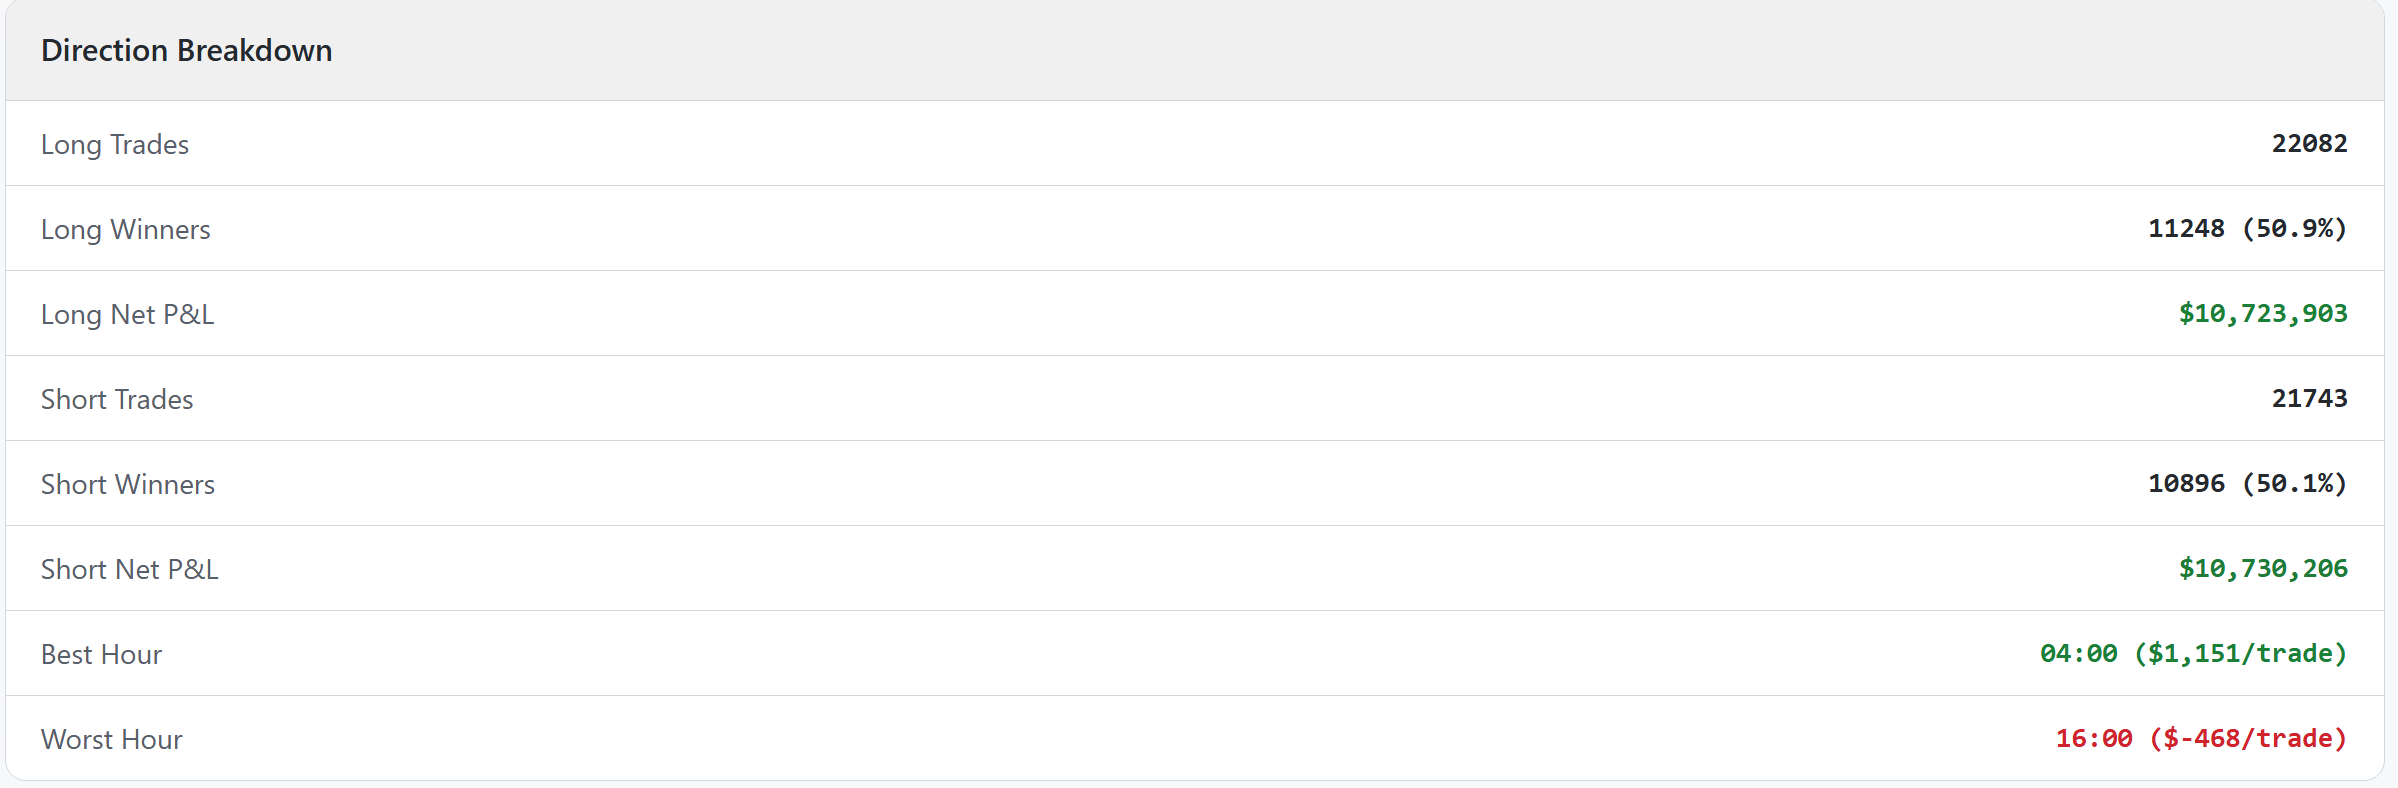
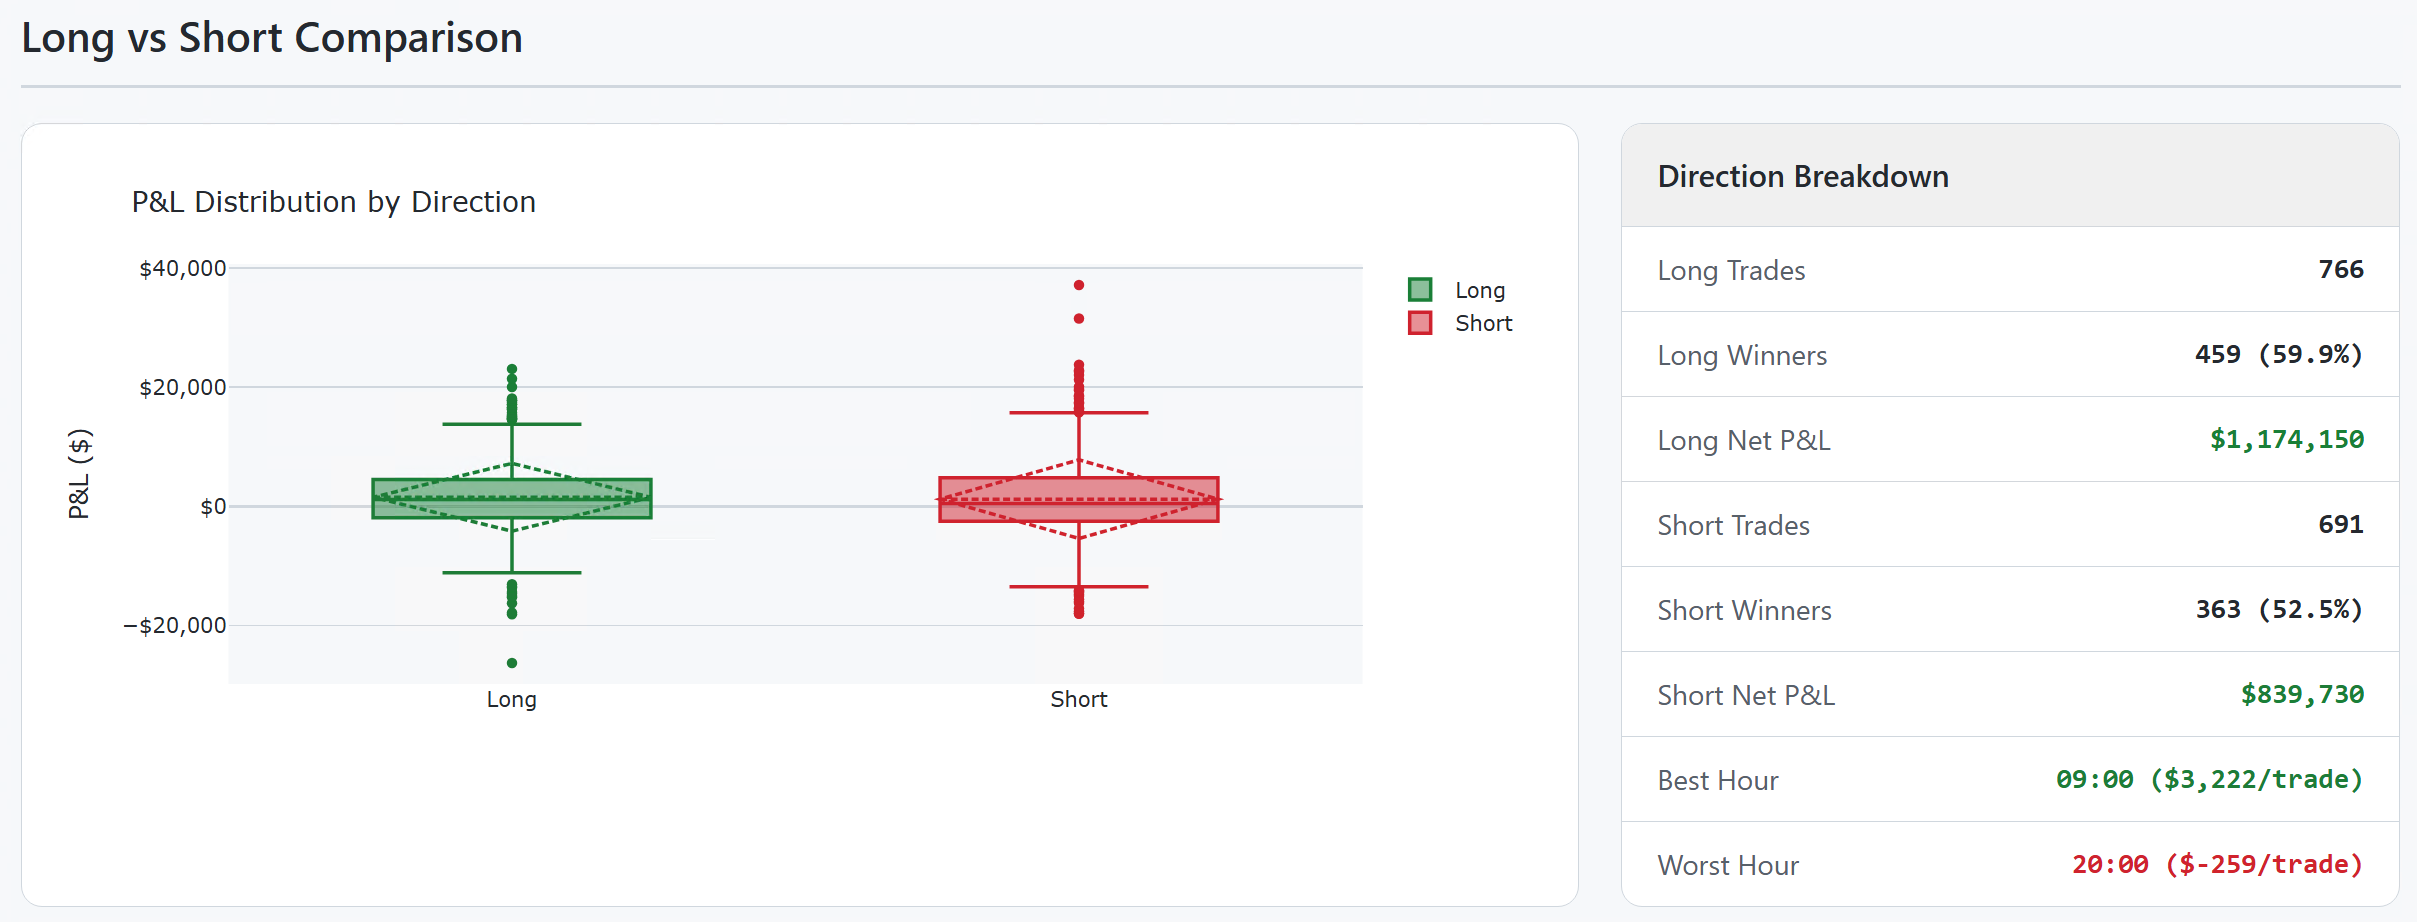
- Symmetry: Both sides make money—Long and Short:
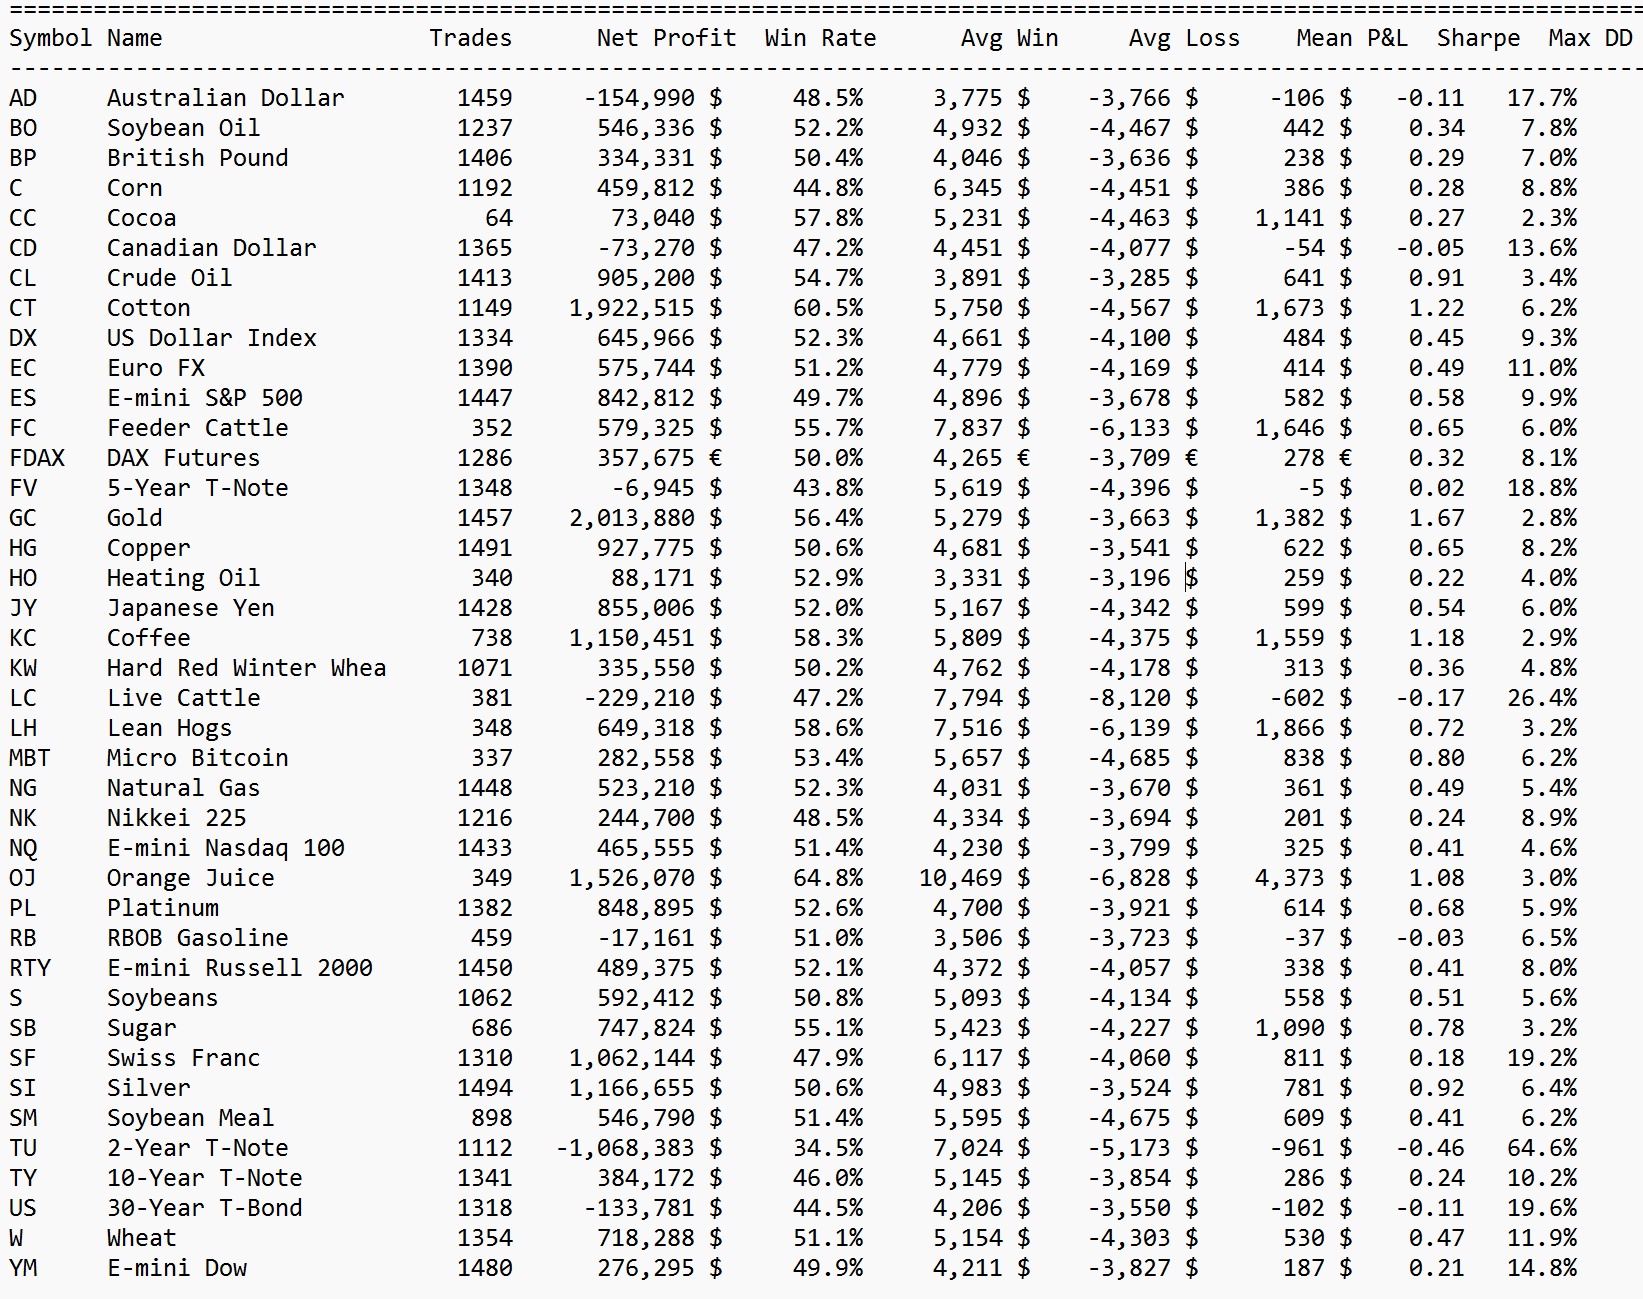
Some markets have truly exemplary results.
This is what the simulation looks like on Gold (GC):
It is fascinating to see how convincingly the probability works on the short side for Gold:
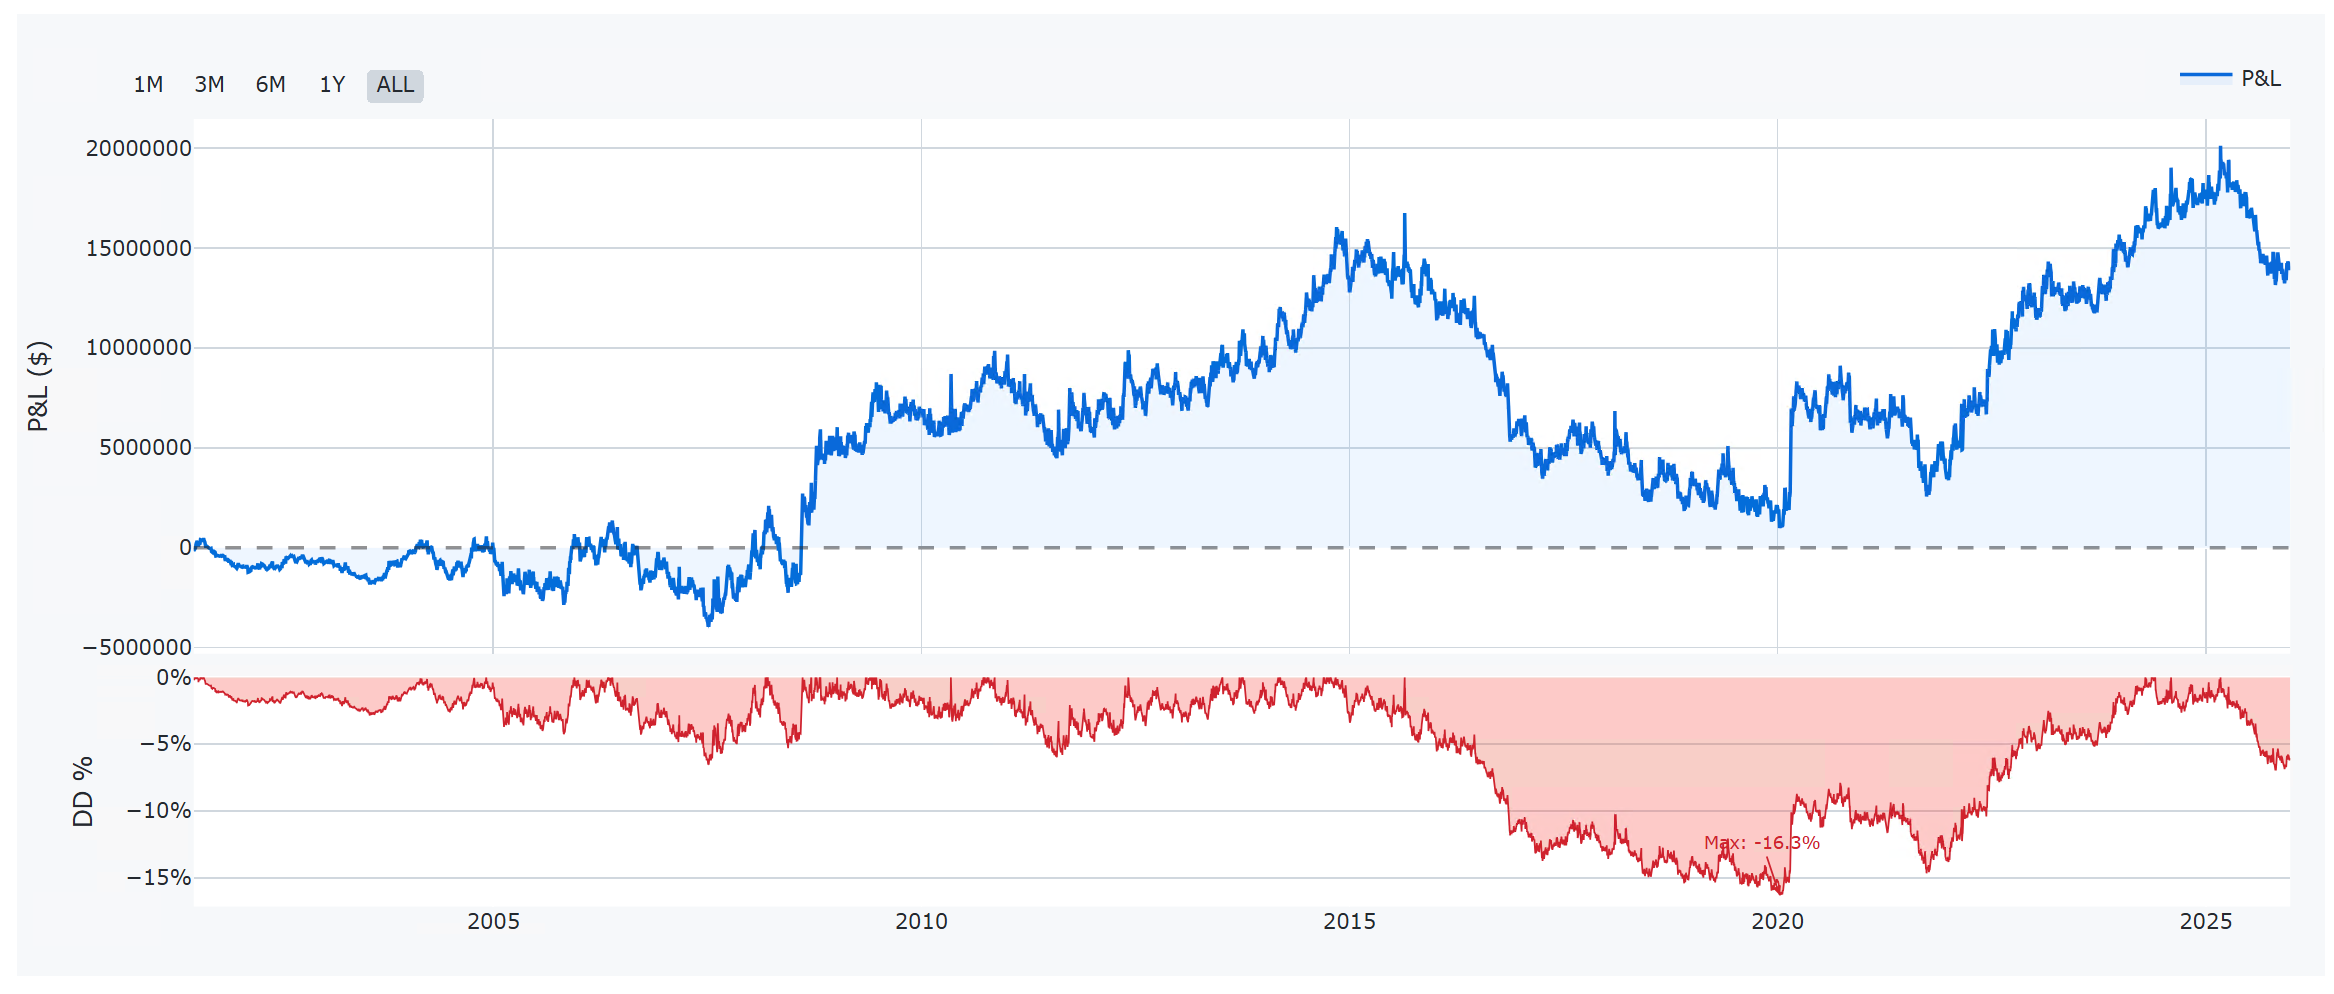
B) Holding 10 Hours (Intraday Trend)
Let's try holding the position longer. What happens if we give the trade room to breathe for about 10 hours:
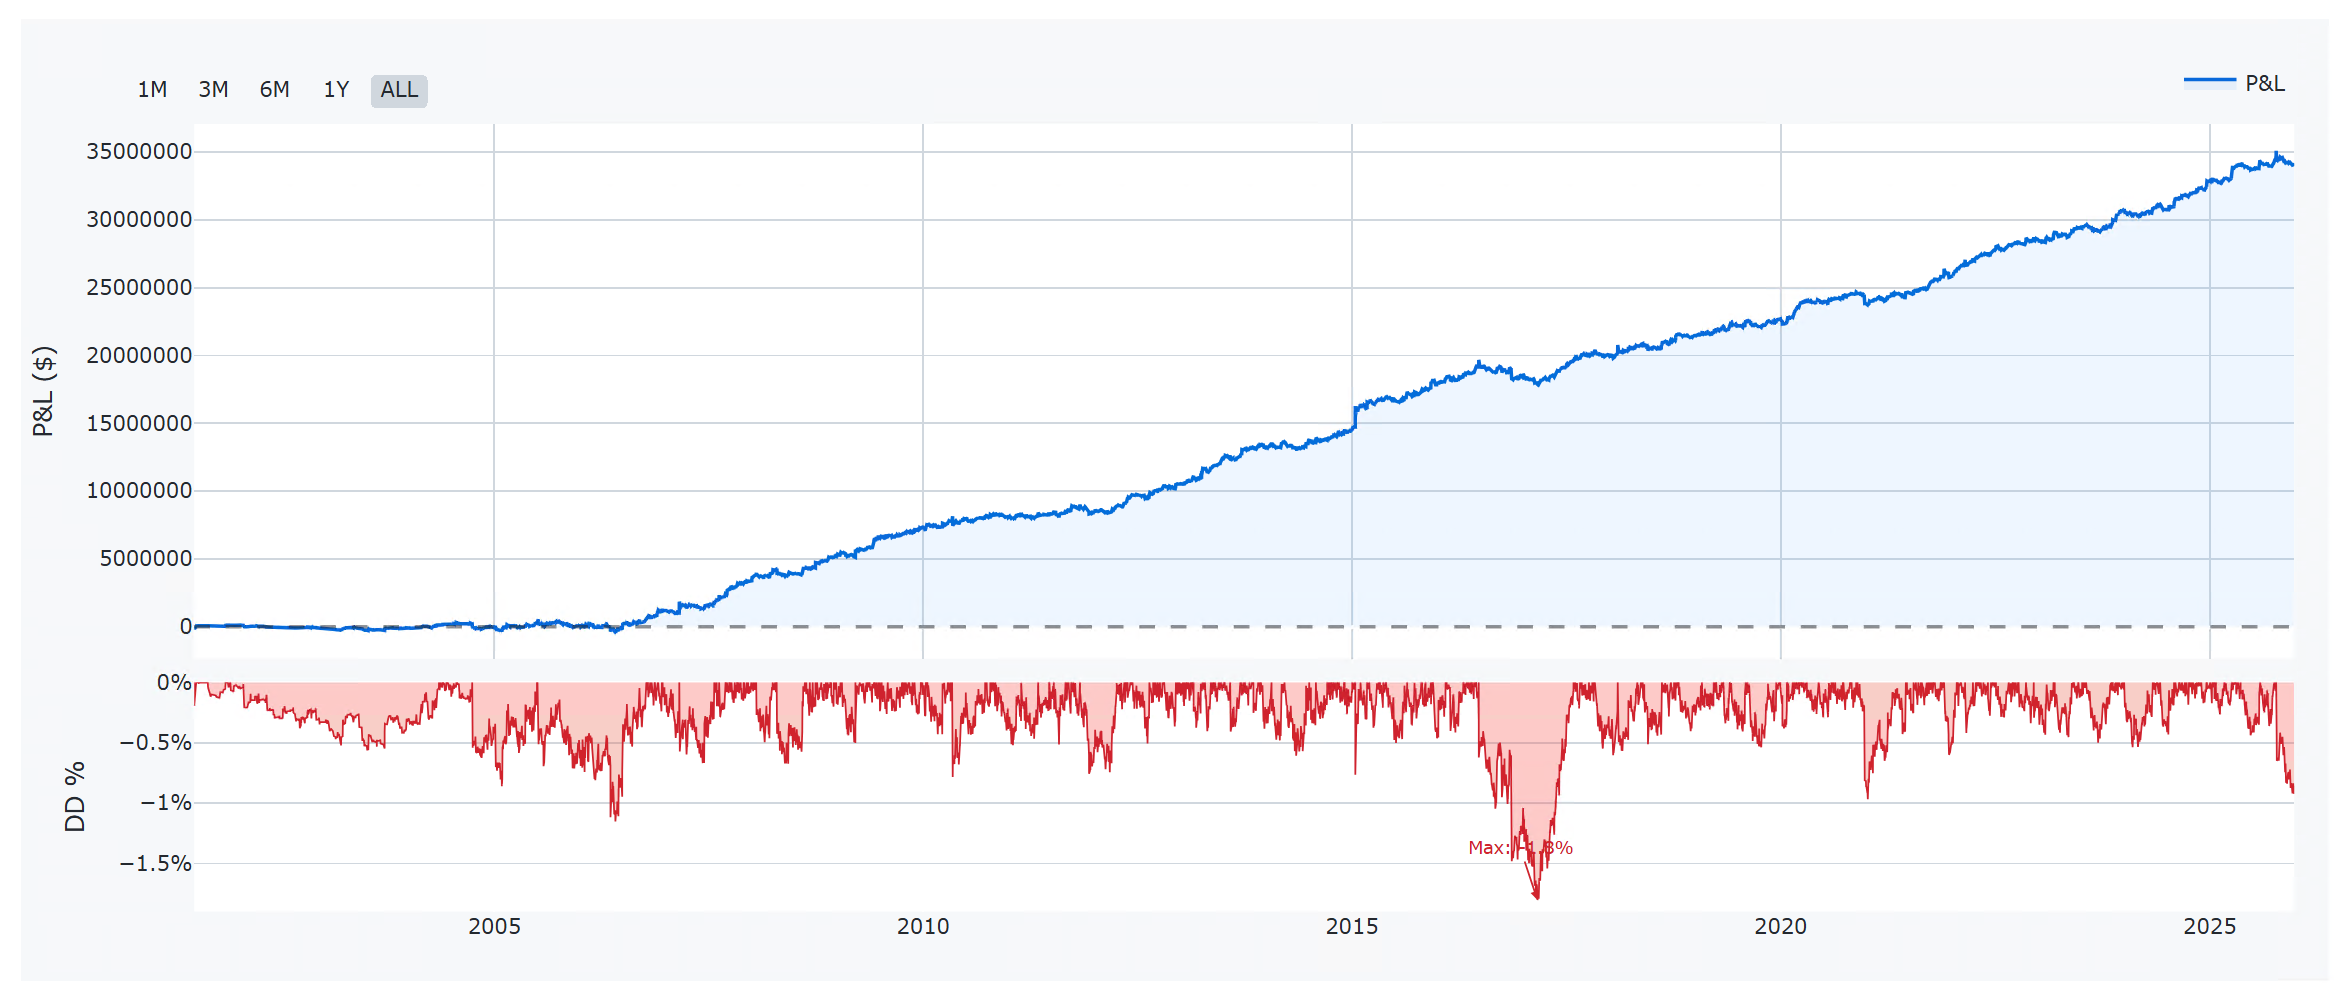
The result? Still excellent.
- Sharpe Ratio: 1.55 (almost unchanged compared to 1 hour).
- Drawdown: Slightly increased.
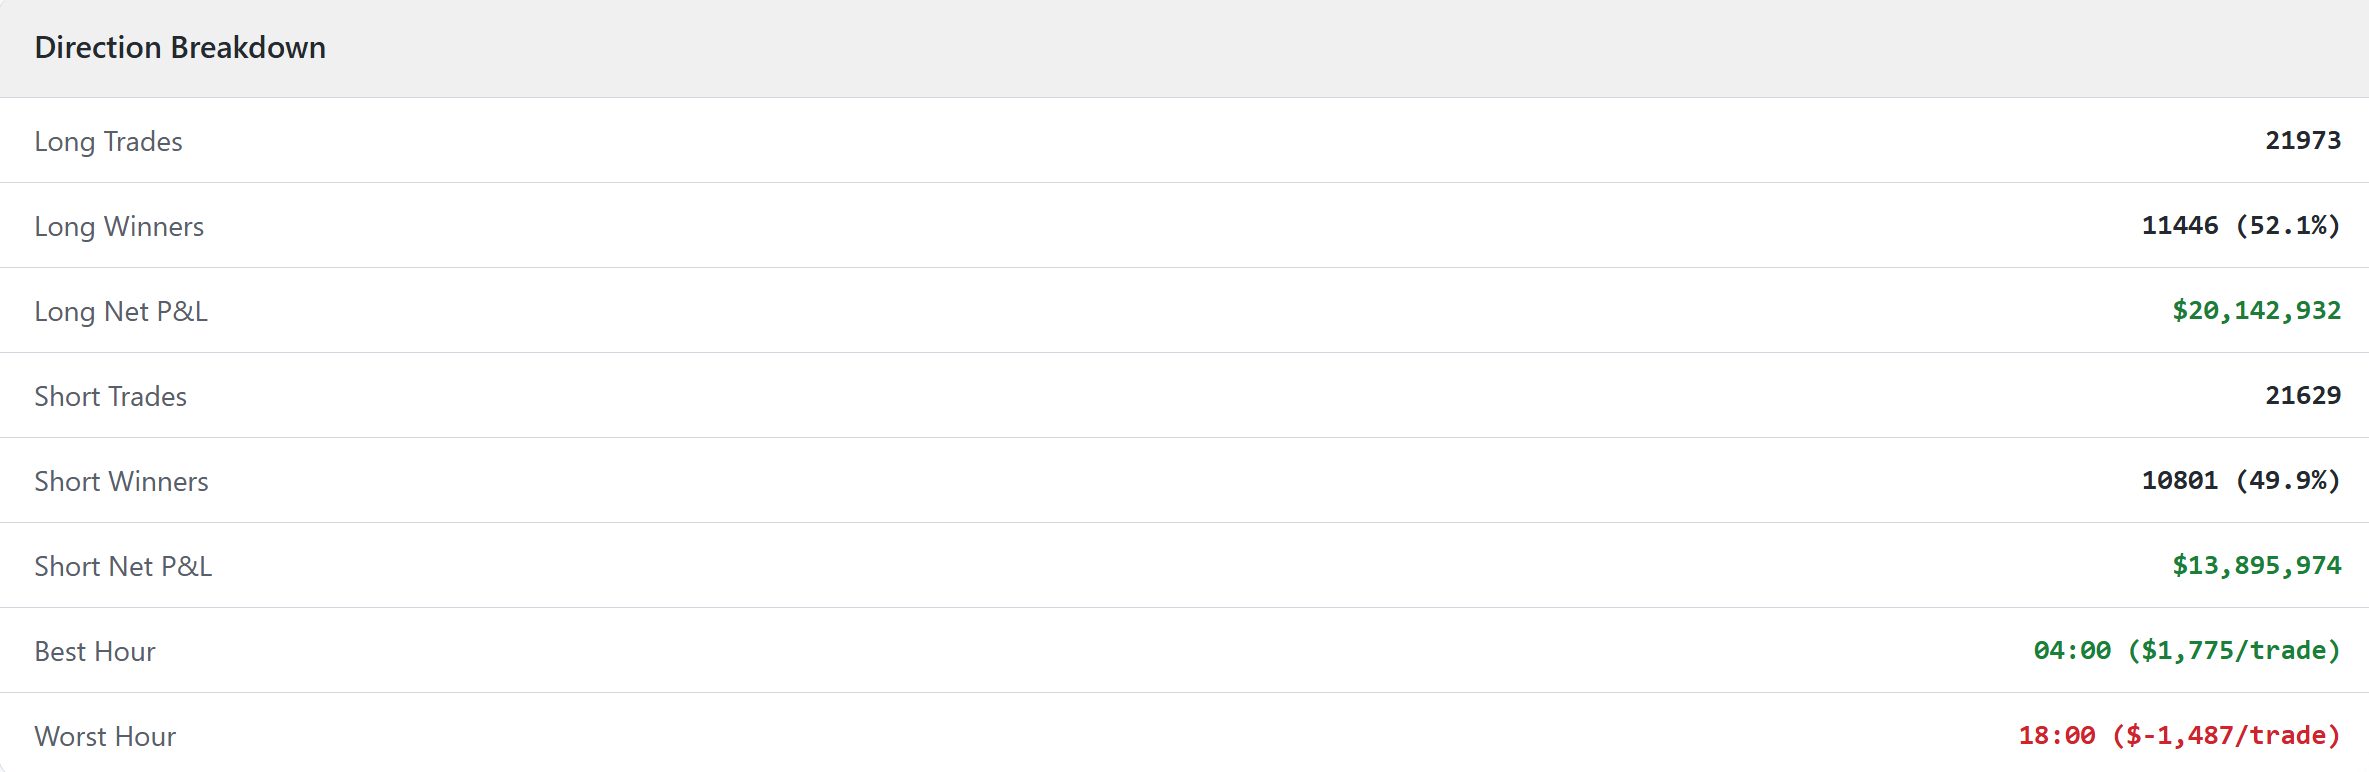
- Characteristics: With more time, the Long side begins to dominate (due to the natural drift of many markets), while the success of Shorts drops slightly, but remains profitable.
4. Control Test: Where Does the Edge Disappear?
Every proper research needs a "control group." I therefore performed a test with an exit after 2 days. The assumption: Short-term momentum after the breakout should fade, and the result should be random or just copy the market drift.
Confirmed.
- Sharpe Ratio dropped to 0.21.
- The equity curve is "messy."
- Profit is generated only by longs on markets that experienced strong bull trends. Shorts are in deep losses.
This test is key evidence that the edge lies in the immediate reaction to the swing breakout. The longer we wait, the more our advantage dissolves into market noise.
Conclusion and Next Steps
This research has given us a clear answer: At the level of significant daily swings, markets have a statistically measurable tendency to continue the movement (breakout), not to reverse.
Moreover, the tendency looks so strong that I plan to build a specific trading system on it. Naturally, with more sophisticated risk management and exits.
If you are looking for a way to trade trends intraday, entries on swing breakouts look like a robust starting point.
Next time, my research will focus on what realistic risk management and, above all, the application of standard costs and slippage will do to these results.

