Within the dashboard, you will find simulated tests of various types of swing stock trading strategies that we ourselves trade in some form. The dashboard therefore does not display the results of live trading, which brings several specific considerations:
- Simulated historical trade “fills” are based solely on historical data. It is possible that some trades, especially shorts, could not have been filled in live trading because, for example, the stock was not available to short. As a result, the simulated trade history may include trades that could not have been executed live.
- In live trading, we may occasionally receive fills for trades, especially with limit entry orders, that are not “executed” in the simulated test. For example, this can happen when the historical price only touched the entry level. As a result, the simulated trade history may occasionally be missing trades that would have appeared in a live account.
- In the trade history, the traded ticker may change when a stock is renamed or delisted. In such cases, the ticker may appear in a format such as PS-202104, which in this specific example means that the stock with the ticker “PS” was delisted in April 2021. The ticker may also change completely, for example if the company merged with another company.
- And naturally, historical fills are only theoretical. In live trading, depending on the order type and share size, execution may involve slippage and similar effects.
The simulated tests and entry signals provide a service similar to generating signals yourself in software such as Amibroker. Even in this case, the signals still require attention and monitoring, including which positions are open, which positions should be open, exits, and so on. However, unlike building and generating your own strategies, with the dashboard you do not need any additional software, any strategy-building know-how, or any extra purchased data.
Strategy Detail
In the left-hand menu, you can navigate through individual groups of systems and select a view of a specific strategy’s detail. Strategies are available based on your subscription type.
On the strategy detail page, you will find a brief description of the strategy in the header, as well as a link to detailed information about the strategy:
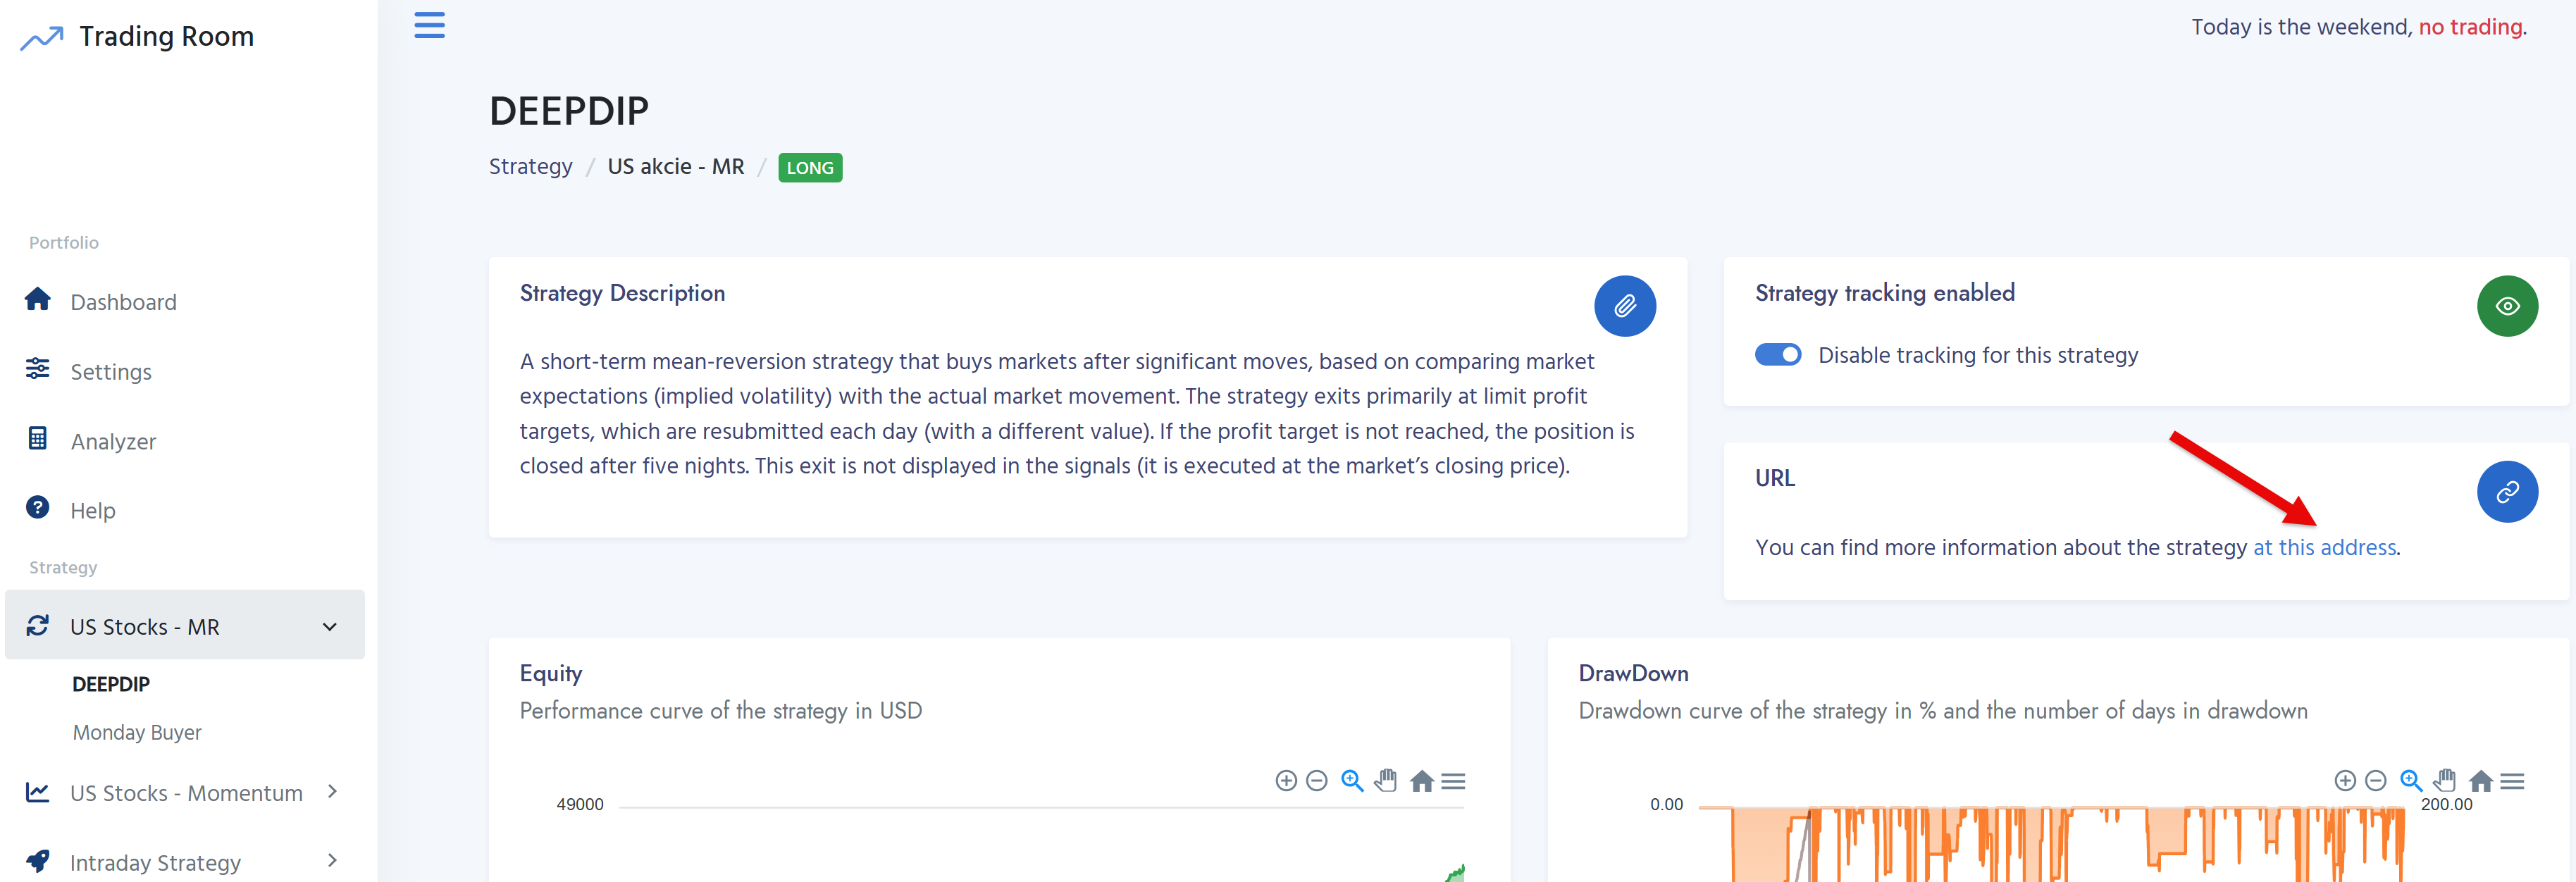
Do not overlook this link, as it contains essential information related to the strategy (such as how exits are generated and similar logic).
In the top-right corner, you can enable strategy tracking:
When tracking is enabled, the strategy’s signals are transferred to the main dashboard page (the home icon).
The page also includes a chart of simulated performance (the strategy’s equity curve), and next to it, a drawdown chart:
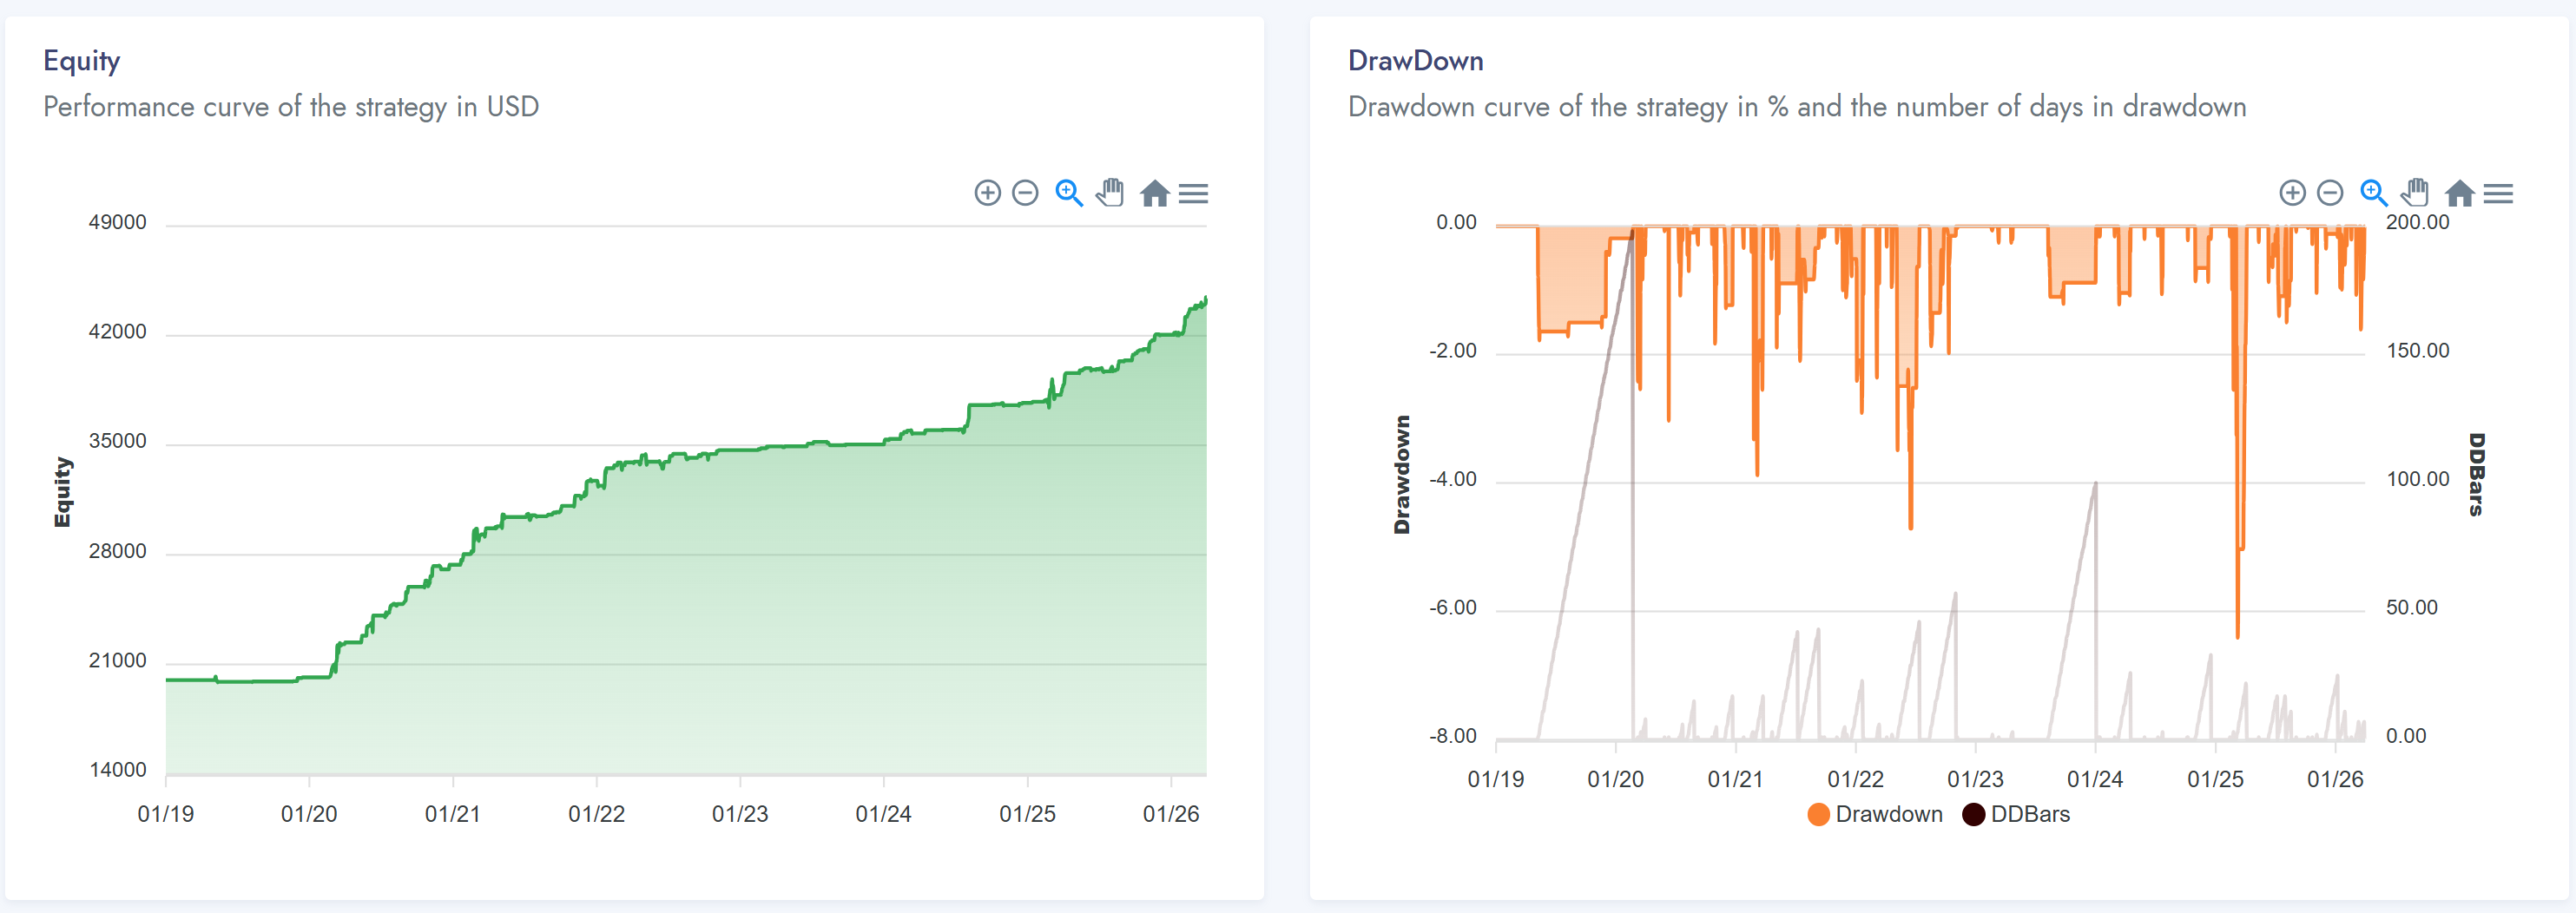
The left axis displays the historical drawdown in percentage terms, and the right axis shows so-called DDBars – the number of days spent in drawdown. Historical statistics for all strategies are calculated using an initial capital of 20,000 USD, shown without reinvestment and with standard commissions charged by Interactive Brokers included. Any dividends (income for long strategies, expenses for short strategies) are also incorporated into the performance.
Today’s Signals
The “Today’s Signals” table contains any new signals prepared for the next trading day.
Special attention should be paid to the Date column. The date shown here must match the date of the most recent trading day. If an older date is displayed, the dashboard has not yet been updated. The dashboard is typically updated around 7:05 AM Central European Time. The table displays both entry and exit signals. Important: Some strategies generate an exit at today’s close; such exits are not shown in the signals table (see the “Exits” section).
Signals in the table are ordered from highest priority to lowest priority.
The Order column indicates whether the position is being bought (Buy) or sold (Sell). If the Info column is empty, the order opens a new position. If the Info column contains “Close,” it means the order closes an existing position.
The Order Type column specifies the type of trading order to be placed. LMT represents a limit entry order at the price shown in the Entry Price column. For example, Buy LMT 2.32 means an instruction to place a limit buy order at 2.32. If the market falls to that price during the trading session, a long position will be opened.
If the Attach PT or Attach SL column contains “yes,” the system places a profit target for the opening position (a closing limit order at the price shown in the PT Price column) or a stop-loss (a closing stop order at the price shown in the SL Price column). If the Attach PT / Attach SL columns are empty, the system does not use a profit target or stop-loss.
Open Trades
The table shows positions that, according to the simulation, should currently be open. As noted above, in practice the list may occasionally differ from the positions actually open in a live account.
The total number of open positions plus newly submitted signals should not exceed the value shown under Maximum Number of Positions in the strategy description.
Historical Trades
The table displays historical trades generated within the simulation. Historical trades are regenerated each day using the latest available data, and if a stock’s ticker changes, for example due to a delisting, merger, or similar event, the change is reflected in the historical trades as well. Execution prices shown in historical trades are only hypothetical. Exits are usually based on the market close or opening price. In live trading, actual fills may differ. Position size in the strategy trade overview is calculated based on an initial capital of $20,000. The results include commissions.
Exits
All strategies use exit rules with fully explained logic, which is described in each strategy’s details. For every entry, you should therefore have a clear understanding of the logic under which the trade will be closed.
Each strategy description also states whether exit signals are generated in the dashboard overview or not. This is what the exit description looks like for the DEEPDIP Long strategy:

Many strategies exit at the market open on the trading day following the moment when the exit condition is met. For these strategies, exit signals are generated in the dashboard overview. In such cases, exit signals in the tables are marked with a red Close label. It is also important to pay attention to the Order Type column. If MOO (Market On Open) is shown, it means a market exit at the market open. Such a position should be closed immediately, without any conditions, as soon as the market opens. If the Order Type is LMT (Limit) or STP (Stop), the exit is executed through a conditional limit order or stop-loss order. This will only occur if the market reaches the price shown in the Exit Price column.
Some strategies, such as the above-mentioned DEEPDIP Long, may exit at the market close. For these strategies, exit signals are not generated in the dashboard overview. If you decide to follow such a strategy, you must monitor the exit signals yourself. In the case of DEEPDIP Long, the exit at the close is simply a time stop: if the position is still open after five nights, I place an MOC (Market on Close) order to close the position before the sixth night.
Some strategies state in their exit description that the exit is also based on a comparison of the market’s closing price with the previous closing price. In this case, the exit can be handled in two ways. For example, you can check the current market price one minute before the end of the trading session and, if the exit condition is met, send a market order. Personally, however, I use Limit on Close (LOC) orders. At any point during the day, I enter an LOC order in TWS, and the position is then closed automatically if the market is above the specified value, in the case of a long position. If you use basket orders, LOC orders will be entered automatically on the first trading day — see the Basket Orders section below. Positions that are closed using a time-based stop-loss are submitted to the market using an MOC (Market on Close) order.
Earnings
The signals for all strategies are based on mechanical price action rules. They do not include any fundamental filters. As a result, the performance curve charts also include trades that would have been opened during earnings announcements, and the historical results show that this approach has been effective. That said, earnings announcements introduce increased volatility into the markets. If a stock is going to gap by, say, 10% of its price, it is more likely to happen as a result of company earnings news. In the dashboard, upcoming earnings dates are marked with a “$” icon. If you decide to take earnings into account when reviewing signals, it is a good idea to check stocks marked with the “$” icon individually in earnings calendars, for example on zacks.com. Earnings calendars can sometimes change at the last minute, so the “$” icon in the dashboard should be treated as indicative only - it is meant to highlight situations that may require additional attention. At present, the “$” icon is shown in the dashboard for U.S. stocks for which an earnings announcement has been scheduled from the previous day up to the next five trading days.
Main Dashboard
The main dashboard displays signals for strategies that have tracking enabled. Tracking can be turned on on the page showing the details of each individual strategy.
For user convenience, the signals are recalculated based on the personal portfolio settings in the Settings section of the menu.
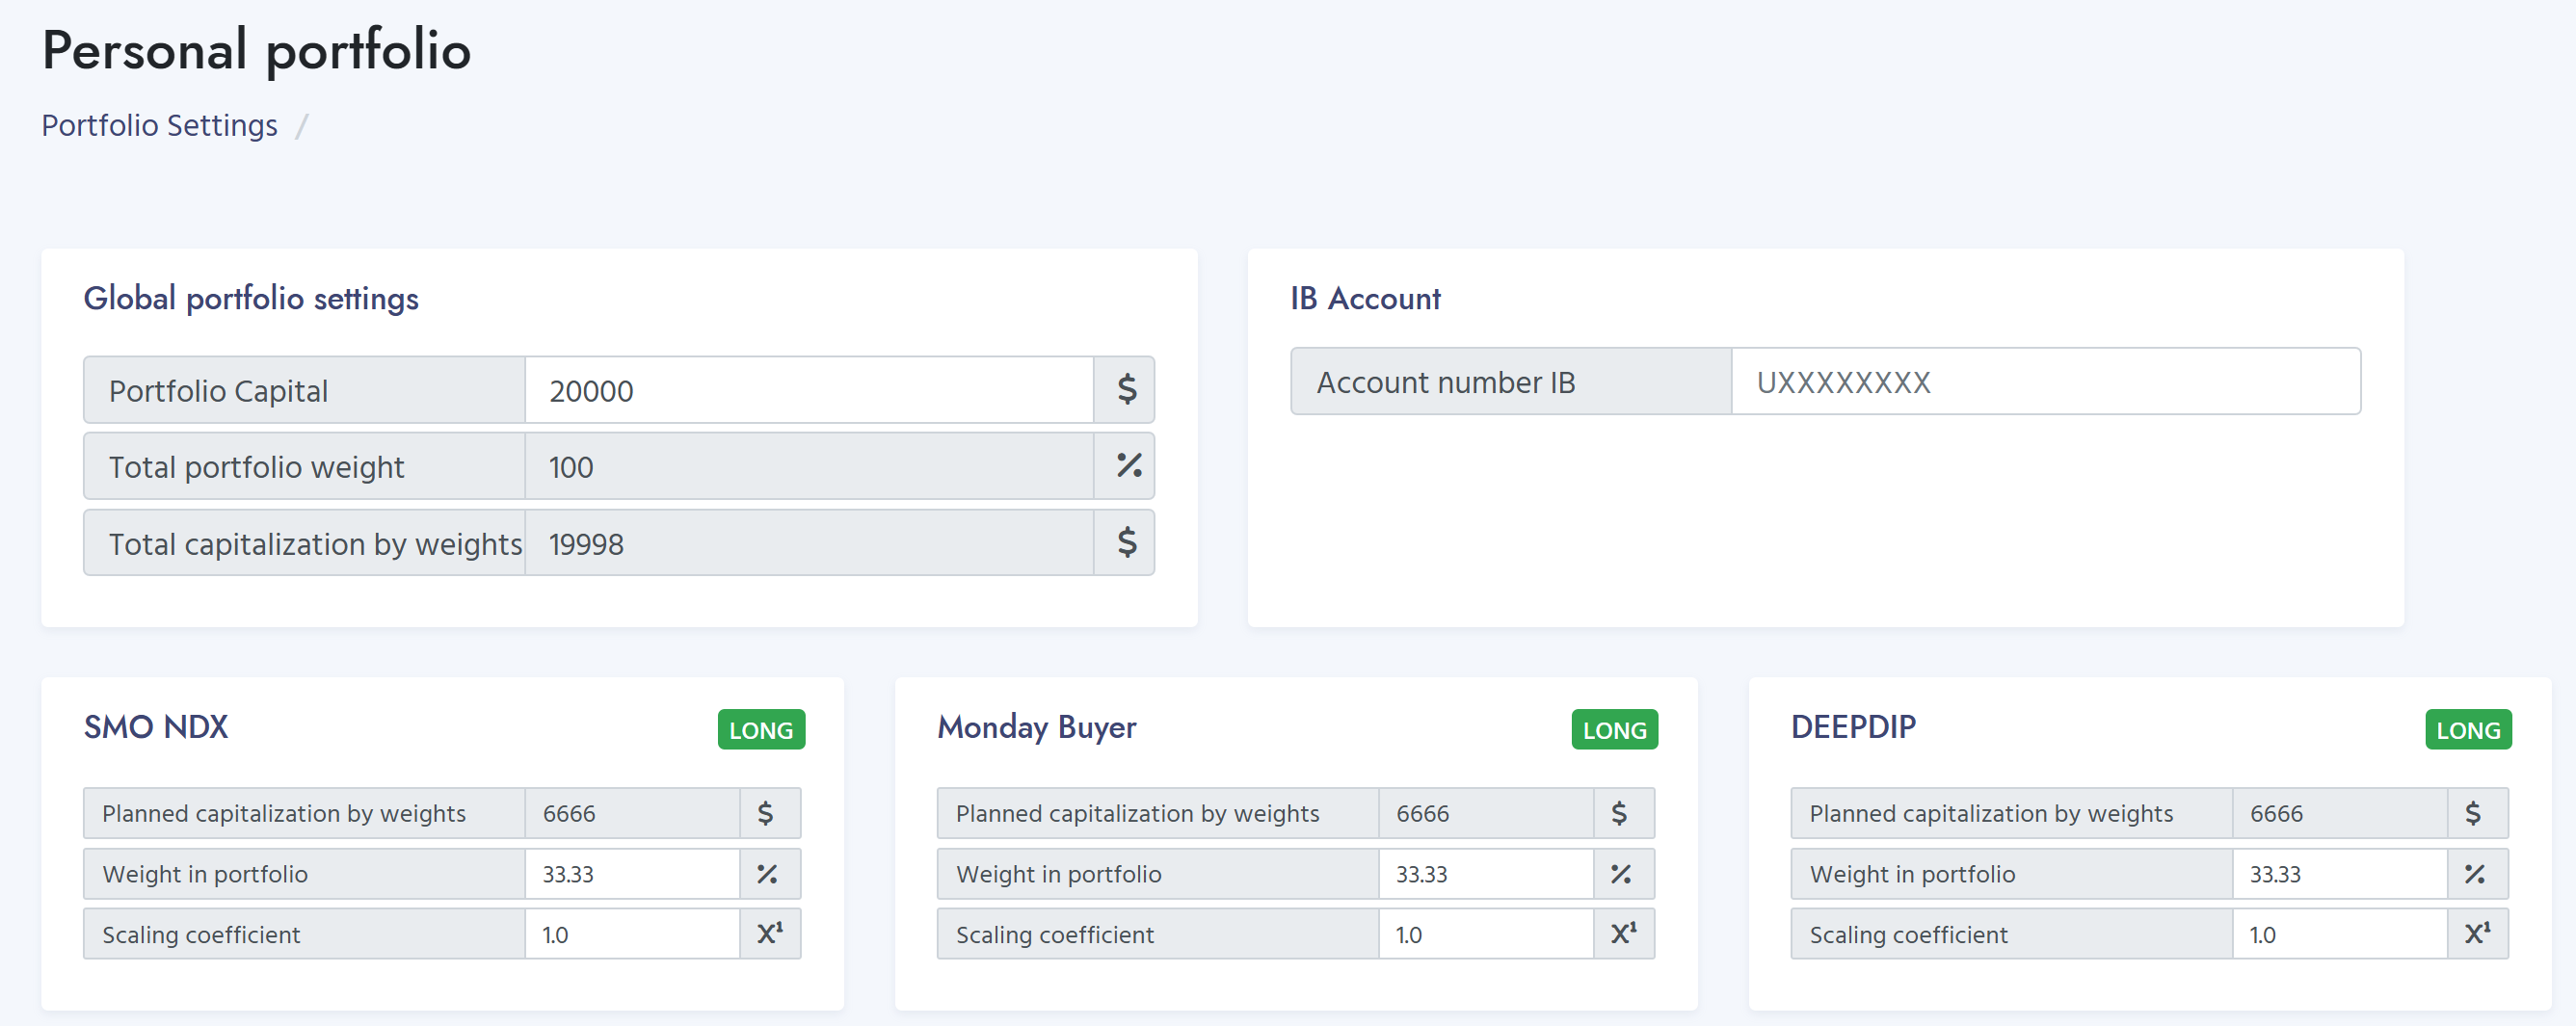
In Portfolio Settings, you can define the portfolio capital and the weights of individual systems. You can also specify your Interactive Brokers account number, which is then included in basket orders that allow bulk transfer of orders to Interactive Brokers.
In the top-right corner of the dashboard, you can enable automatic e-mail delivery of signals:
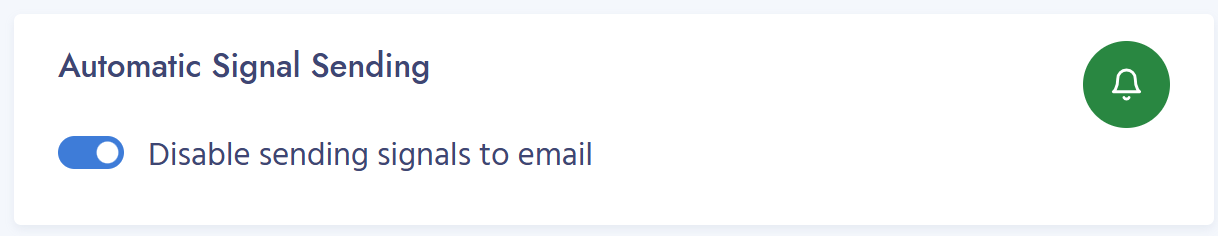
If enabled, you will receive a daily email with an overview similar to the one displayed in the dashboard.
Within each individual strategy, you can monitor both entry and exit signals directly in the dashboard.
Signals can be downloaded below the table in CSV format.
TWS BasketTrader Orders
For some systems, so-called basket orders are also generated, allowing orders to be transferred in bulk to Interactive Brokers using the BasketTrader tool.
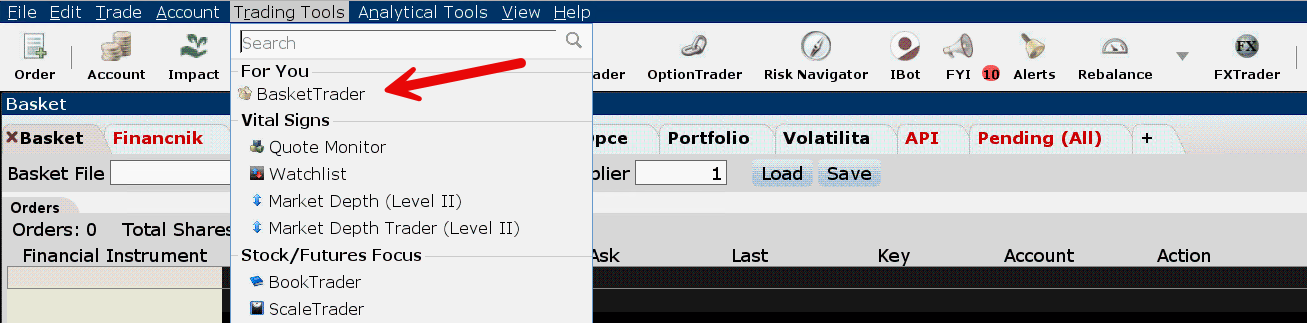
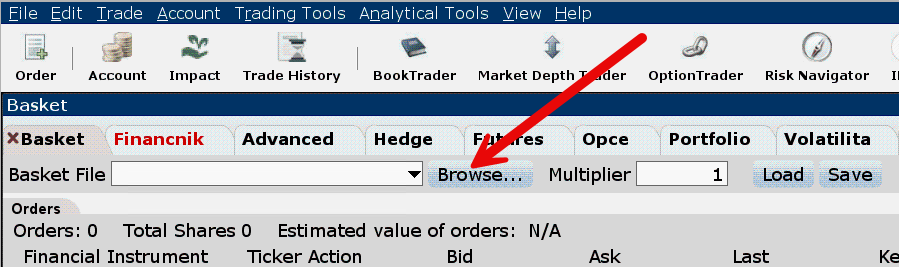
You simply need to download the generated file and upload it into TWS as a Basket File:
Important: Basket orders contain only entry orders. On the first day, they may also include exit orders attached as conditional orders — for example, a profit target. These exit orders are activated only if the entry order is executed.
Once a position has been opened, any exit signals on subsequent days must be entered manually. This is because the dashboard has no knowledge of which specific positions are currently open in TWS.
If the basket order also contains conditional exit orders, you should always check in TWS after uploading the file whether the conditional link has been transferred correctly.
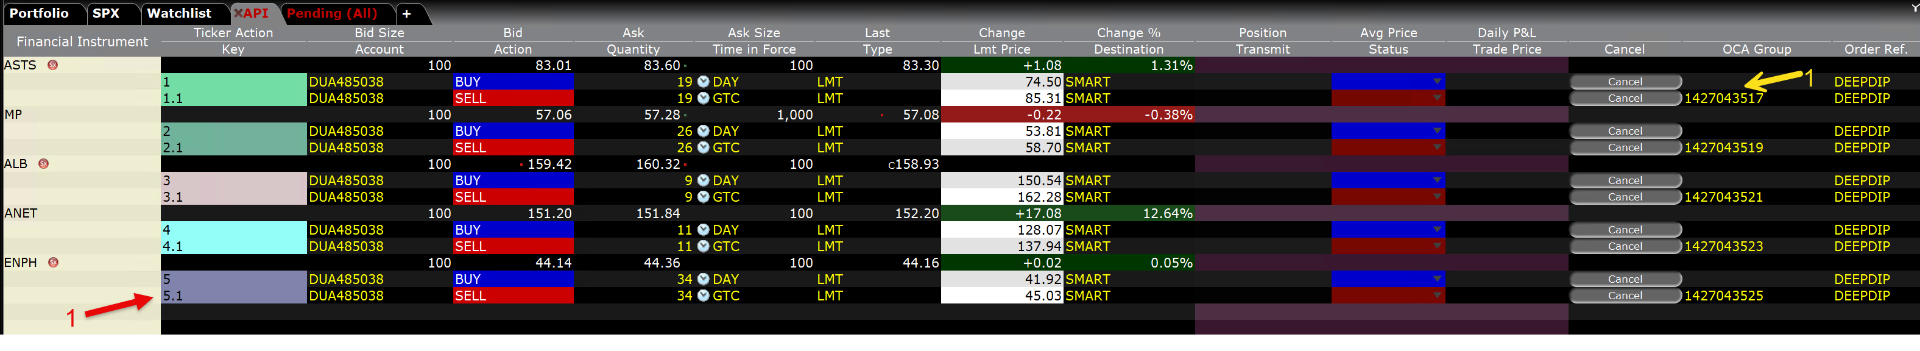
For exit orders, you should see a decimal value in the Key column and also some value in the OCA Group column (point 1). If these values are missing, the OCA link was not created, and the entry and exit orders were transferred as independent orders. In that case, an exit order could be executed even though the entry order was never executed first.
TWS API BasketTrader
Because uploading basket orders into TWS using BasketTrader does not always work reliably — in some cases the required OCO links between entry and exit orders are not created correctly — we have prepared an alternative Python script that uploads orders via the API, which works reliably.
This script provides the same functionality as submitting downloaded basket orders through the TWS basket feature, but it does so through the API.
You can download the script here: https://files.cracking-markets.com/BasketTraderv02.zip
Follow the instructions in BasketTrader_Instructions.md to set up the script.
Automated Downloads
Both CSV and basket files can also be downloaded automatically, without the need to log in to the dashboard. Simply copy the URL of the relevant link and append your personal hash after the final slash. You can find your hash in the left-hand menu under Copy hash.
For example, the URL for the MondayBuyer strategy CSV signals is:https://tradingroom.financnik.cz/download/MondayBuyer/csv
To download the file automatically, simply call:https://tradingroom.financnik.cz/download/MondayBuyer/csv/XXX
where XXX is your personal hash.
Only data for strategies that you have enabled for tracking are available. These are the same strategies whose signals are displayed on the main dashboard. The CSV download contains the same information as the one shown in the corresponding strategy signal tables on the main dashboard.
You can also download, for example, the portfolio’s open positions. The URL is:https://tradingroom.financnik.cz/download/OPEN_TRADES/csv/XXX
where XXX is again your personal hash.
Analyzer
The Analyzer is a tool for analyzing systems presented in the dashboard. It enables detailed performance analysis of both individual systems and, most importantly, systems combined into portfolios traded simultaneously. Results can also be compared against a selected benchmark. Systems in the dashboard are updated daily.
Analyzer limitations: The dashboard web application does not run backtests on its own. Backtests are imported once per day from Amibroker, which generates backtests for individual systems using an initial capital of $20,000. The Analyzer then adjusts those positions according to the capital specified by the user. As a result, small rounding differences in position sizing may occur. For practical purposes, these differences are not significant.
An important characteristic of the Analyzer is that all analyses are based on closed trades only. Account fluctuations during open positions are not taken into account. Therefore, risk metrics in the Analyzer are based on trade-to-trade data, meaning realized profits and losses from closed trades.
Disclaimer
Dashboard is provided exclusively for educational purposes. All information published here, including basket orders, is intended for simulated trading, educational use in trading on various exchanges, and portfolio construction. The operator is not an investment advisor, and none of the information provided here constitutes investment advice.