
When building an intraday systematic strategy, the quality and consistency of historical data can make or break your trading results. Cost, however, is also a critical factor for many traders.
We conducted a comprehensive analysis comparing three popular data providers offering REST APIs for intraday minute-level data: TradeStation, Polygon.io, and Alpaca. These providers differ significantly in their pricing models. TradeStation and Alpaca are brokers that offer historical data access under certain conditions (often free with an account), while Polygon.io is a specialized data provider charging a fee for access. This article focuses specifically on 1-minute intraday bars for US stocks/ETFs, though all three providers also offer tick data and data for other asset classes.
Pricing of the Data
- Alpaca: Offers up to 10 years of historical 1-minute data completely free for open accounts, even unfunded ones.
- TradeStation: Provides 10+ years of historical 1-minute data free for customers. However, to access it via their REST API, your account must be funded with a minimum of $10,000.
- Polygon.io: A dedicated data provider with various subscription tiers. Their "Stocks Developer" tier, priced at $79 USD/month, provides access to up to 10 years of historical stock data.
REST API: The Gateway to Market Data
All three services utilize REST API technology, making them convenient options for systematic traders. A REST (Representational State Transfer) API is an architectural style that allows different systems to communicate via simple web requests. Think of it as visiting a specific website address to retrieve precisely the data you need.
Here's a simple Python example demonstrating how data retrieval works:
# Simple example of an API request to get QQQ data
import requests

# The API endpoint (like a specific web address for the data)
# Note: This is a generic example URL.
url = "https://api.example.com/v1/stocks/QQQ/bars?timeframe=1Min&start=2025-04-01T09:30:00Z&end=2025-04-01T16:00:00Z"

# Make the request (just like visiting a website)
# Replace 'your_api_key' with your actual API key
response = requests.get(url, headers={"Authorization": "Bearer your_api_key"})

# The data comes back in a structured format (usually JSON)
data = response.json()

# Now you have your market data ready to use
# The exact structure of 'data' will vary by API provider
# This is a hypothetical example of accessing a closing price
if data.get('bars'):
    print(f"QQQ closing price: ${data['bars'][0]['c']}") # 'c' is often used for close
else:
    print("Could not retrieve data or 'bars' key not found.")
This simplicity allows traders to access market data without needing complex infrastructure or extensive technical expertise. With just a few lines of Python code, it's possible to download historical data for numerous markets, save it to a CSV file, analyze it in Python, or import it into various backtesting software.
Data Source Quality Matters
For algorithmic traders, data is the bedrock upon which all trading strategies are built. Developing a robust trading strategy is already a challenging endeavor. Therefore, traders must be able to trust their data, especially when using free or low-cost sources. However, when relying on a single data provider, it can be difficult to independently evaluate the quality and consistency of the information received.
For this reason, we analyzed 1-minute data for QQQ (an ETF tracking the Nasdaq 100) from the three aforementioned providers. Our goal was to identify patterns and meaningful discrepancies that could affect trading performance, thereby helping traders make informed decisions about which data source best suits their needs.
Methodology: How We Tested the Data
We analyzed data for QQQ, a prominent ETF frequently used in intraday strategy development. Our analysis utilized a custom Python-based comparison framework to evaluate data across all three providers. We examined data from January 2, 2025, to May 16, 2025, focusing on the main trading session (9:30 AM - 4:00 PM ET).
The comparison methodology included:
- Price Correlation Analysis: Measuring the correlation between closing prices.
- Volume Comparison: Analyzing total, mean, and median volumes.
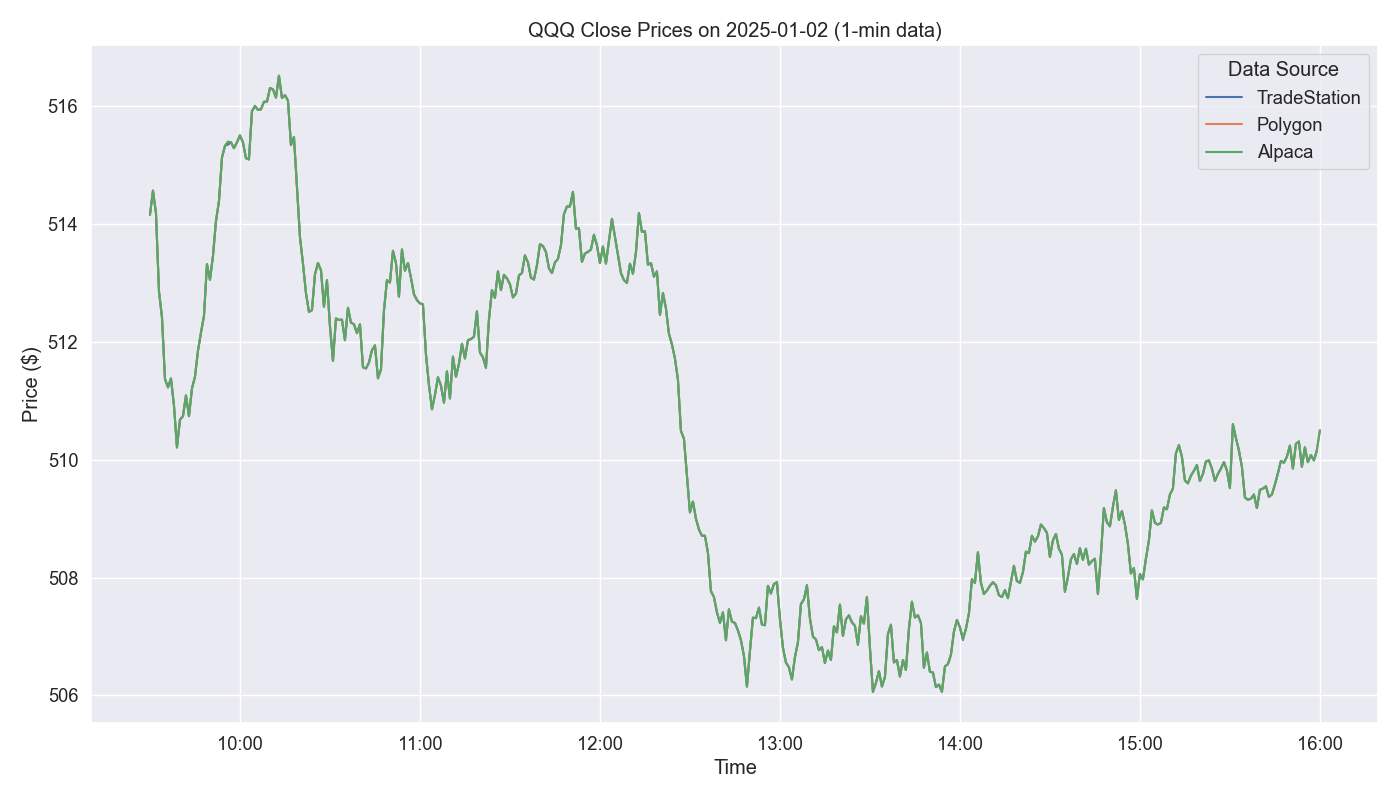
- Sample Day Examination: Conducting a detailed analysis of intraday price movements.
- Opening/Closing Price Comparisons: Identifying statistical differences at market open (9:30 AM bar) and market close (3:59 PM bar).
- First 5-Minute Range Analysis (9:30 – 9:35 AM): Comparing the open-high-low-close (OHLC) range of the first 5-minute bar of the trading day.
- Discrepancy Identification: Locating and analyzing the largest differences in 1-minute closing prices and the first 5-minute ranges.
Key Findings: Remarkable Consistency with Some Surprises
1. Near-Perfect Price Correlation
The closing price correlation between all three data sources for 1-minute QQQ data is an impressive 1.0, indicating perfect statistical correlation. This exceptional consistency suggests that price-based trading signals would perform nearly identically regardless of the data provider.
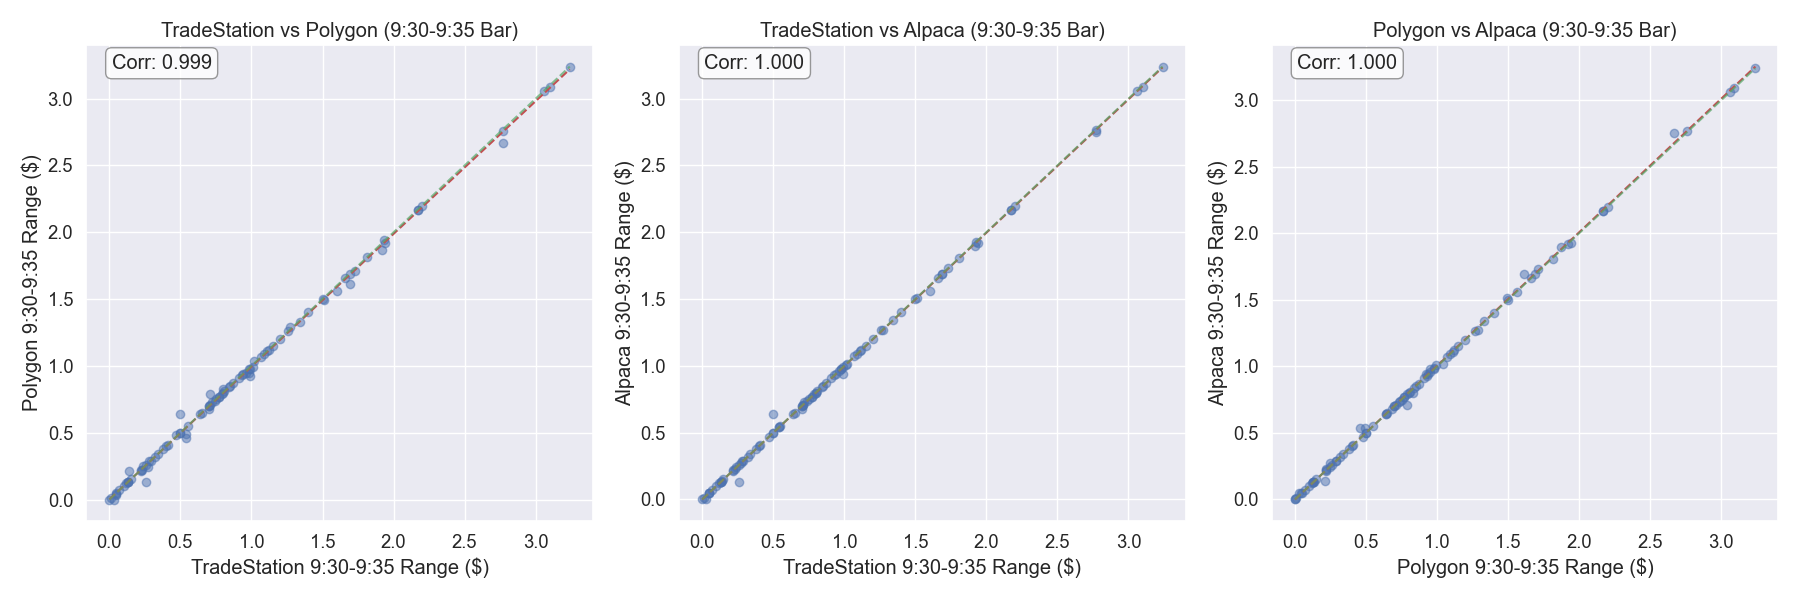
When specifically examining the first 5-minute open-close ranges (9:30 AM - 9:35 AM), the correlation remains extremely high:
- TradeStation vs. Polygon: 0.999165
- TradeStation vs. Alpaca: 0.999586
- Polygon vs. Alpaca: 0.999618
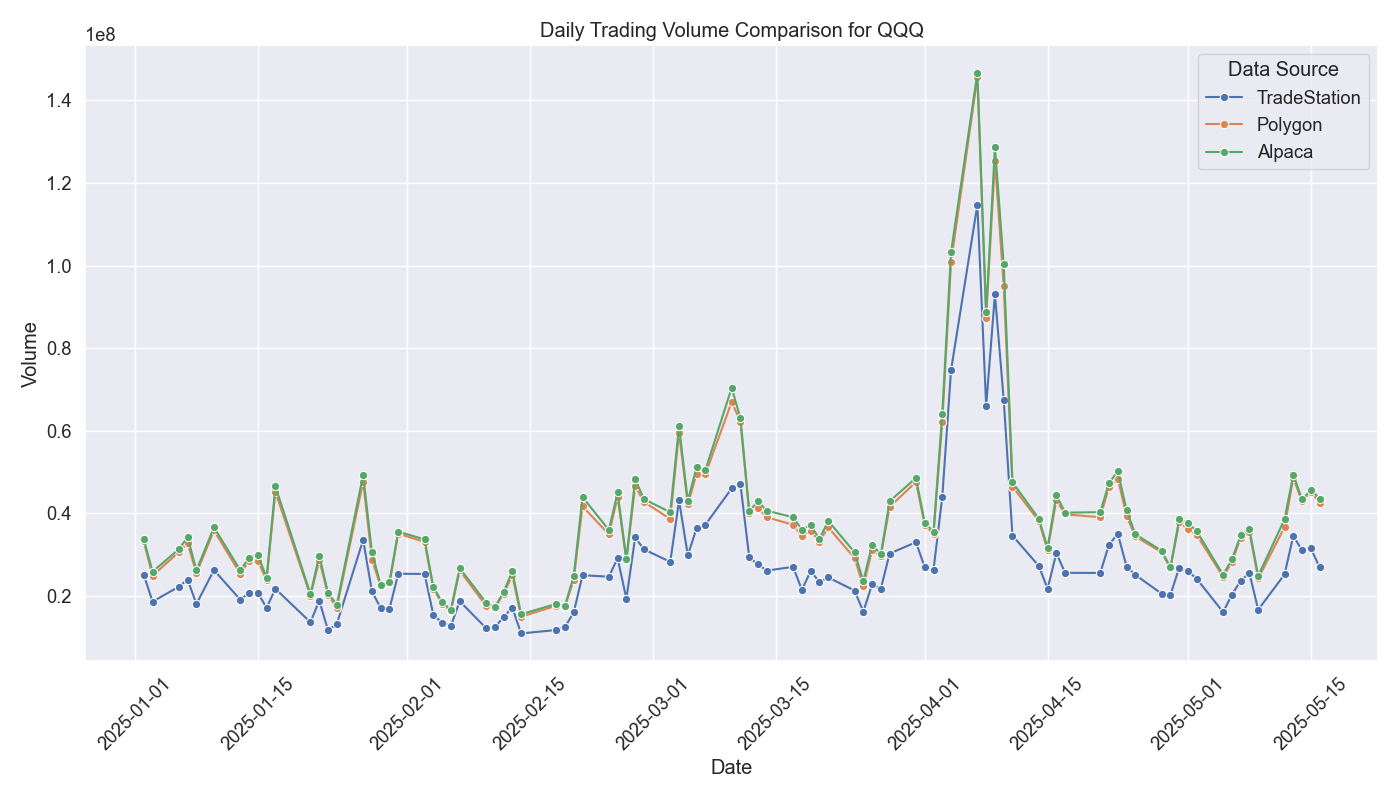
2. Significant Volume Discrepancies
The most substantial difference observed among providers was in volume reporting:
- TradeStation: Mean volume per minute of 70,346.19
- Polygon.io: Mean volume per minute of 98,429.94
- Alpaca: Mean volume per minute of 101,083.43
TradeStation consistently reports significantly lower volume than the other sources (approximately 28.53% less than Polygon.io and 30.41% less than Alpaca). This discrepancy could impact volume-based strategies. Meanwhile, Polygon.io and Alpaca show a minimal 2.70% difference in total volume between themselves.
3. Price Differences: Small but Potentially Significant (1-Minute Data)
Despite the perfect correlation in overall price movement on 1-minute bars, our analysis uncovered notable differences in specific price points. The largest single price difference observed was $0.43 on April 11, 2025, at 11:01 AM, between TradeStation and both Polygon.io/Alpaca. The top 10 largest differences in 1-minute closing prices ranged from $0.225 to $0.43.
For an ETF like QQQ, typically trading in the $400−$500 range during the study period, these differences represent a very small percentage of the price and would rarely affect most trading decisions. However, they introduce potential risk for high-precision strategies sensitive to minute price variations.
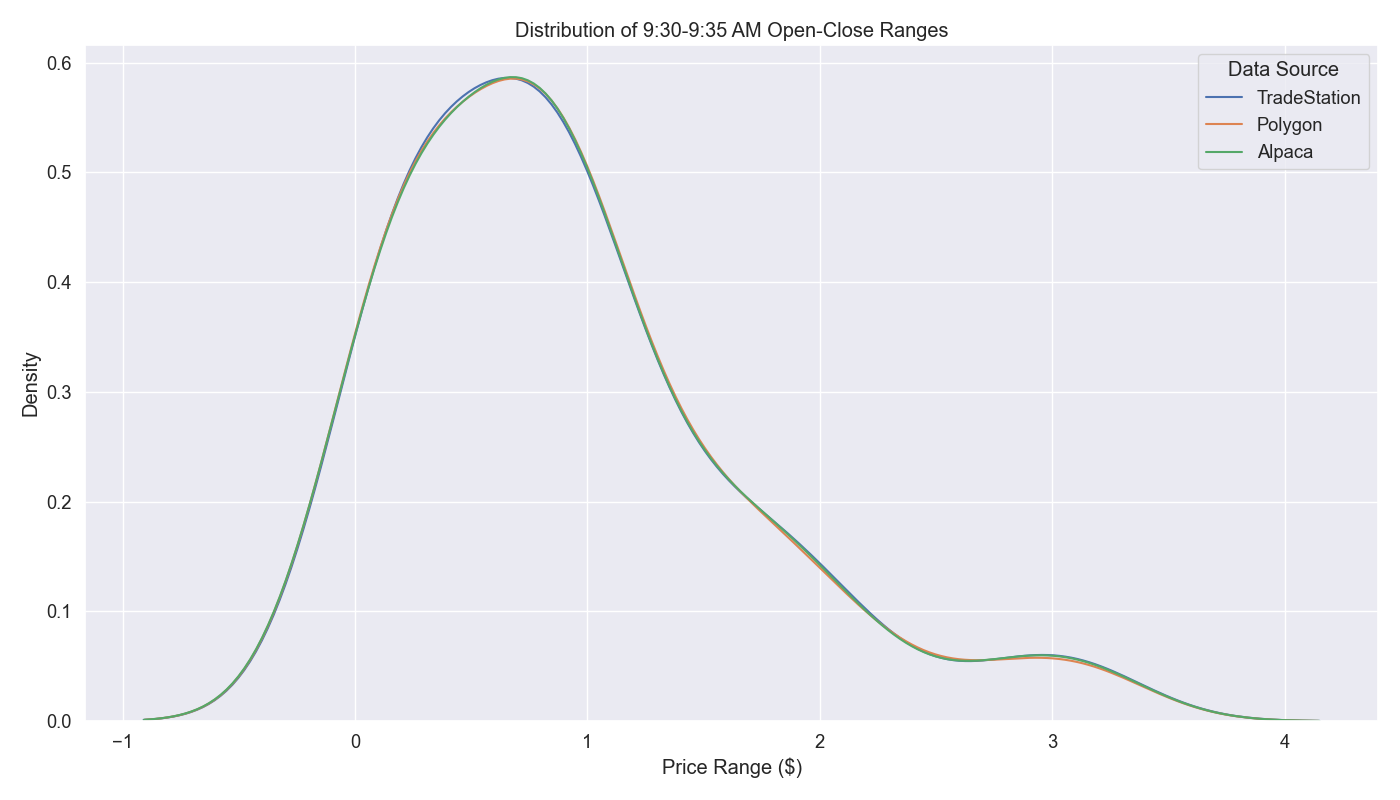
4. First 5-Minute Range Analysis (9:30 AM - 9:35 AM)
The analysis of the open-close range for the very first 5-minute bar of the trading day (9:30 AM - 9:35 AM) revealed the following mean ranges:
- TradeStation: $0.9181
- Polygon.io: $0.9131
- Alpaca: $0.9160
Discrepancies in the First 5-Minute Range: While highly correlated, there were still differences. The top 3 largest discrepancies in the calculated range for the 9:30 AM - 9:35 AM bar were:
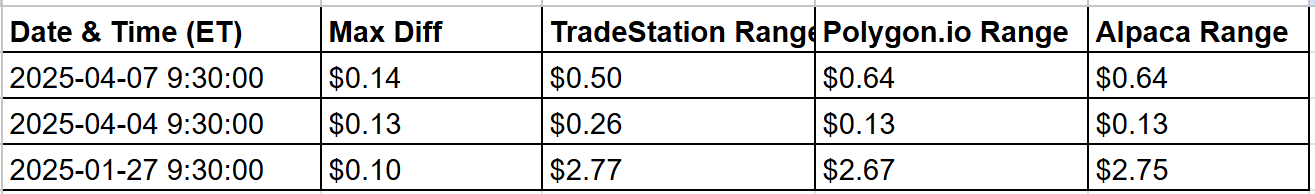
Detailed statistics on these differences show:
- TradeStation vs. Polygon.io: Mean absolute difference of $0.0140, with 2.15% of ranges differing by more than $0.10.
- TradeStation vs. Alpaca: Mean absolute difference of $0.0057, with 2.15% of ranges differing by more than $0.10.
- Polygon.io vs. Alpaca: Mean absolute difference of $0.0087, with 0.00% of ranges differing by more than $0.10.
This indicates extremely high consistency between Polygon.io and Alpaca for the opening 5-minute bar's range, with slightly larger, though still small, average differences when comparing with TradeStation.
Practical Implications for Traders
1. For Price-Based Strategies The near-perfect price correlation (1.0 on 1-minute data, and >0.999 on the first 5-minute range) means that price-based strategies should backtest and perform almost identically across all three providers. However:
- Exact Price Entries/Exits: The small differences in 1-minute data (up to $0.43) or in the components of the first 5-minute bar (max range difference $0.14) could occasionally trigger different entry/exit signals for highly sensitive strategies.
- Strategies Focusing on the First 5 Minutes: While highly consistent, be aware that even small discrepancies in the open, high, low, or close of this initial bar can alter derived indicators or exact range calculations. Polygon.io and Alpaca are virtually interchangeable in this regard.
2. For Volume-Based Strategies Volume data shows the most significant differences:
- Strategies relying on absolute volume levels will exhibit different behavior with TradeStation compared to Polygon.io/Alpaca.
- Volume-Weighted Average Price (VWAP) strategies may yield different results.
- Volume breakout strategies could trigger at different times or not at all depending on the source. Consider using relative volume metrics (e.g., volume as a multiple of its moving average) if switching providers or aiming for source-agnostic signals.
Conclusion: A Clear Winner in Affordable Historical Market Data
Our analysis reveals that TradeStation, Polygon.io, and Alpaca all provide high-quality intraday price data for active ETFs like QQQ. This is evidenced by exceptional closing price correlations and very high consistency in the critical first 5-minute range of the trading day. However, significant distinctions in volume reporting and subtle price discrepancies point to a clear hierarchy for traders prioritizing cost-effectiveness and ease of access.
Alpaca emerges as the standout winner for algorithmic traders seeking reliable and affordable historical intraday data. Their offering provides data virtually identical in price characteristics to Polygon.io's paid service. The crucial advantage is that Alpaca requires only an account registration—no funding necessary—to access up to 10 years of this professional-grade data completely free.
Polygon.io offers data of comparable quality to Alpaca, especially regarding price. If a dedicated data provider is preferred, or if issues arise with brokerage-provided data (e.g., rate limits, specific data needs not covered), Polygon.io is an excellent choice, albeit with a monthly fee.
TradeStation delivers reliable price data but with the significant caveat of consistently reporting 28−31% lower volume compared to the others. While their price data maintains high correlation, the $10,000 account funding requirement for API access might be a barrier for those solely wanting data for research and backtesting. For the first 5-minute range, TradeStation shows slightly more deviation from Polygon.io/Alpaca than they do from each other, though these differences remain very small. Traders using TradeStation should be particularly cautious with volume-based indicators and strategies.
Final Verdict: Free Doesn't Mean Low Quality
If you are looking for data to backtest intraday strategies, Alpaca's free historical data offering provides exceptional value. Our analysis confirms that this resource delivers high-quality data, especially concerning price, showing near-perfect correlation with Polygon.io's professional service.
The ability to access what appears to be professional-grade market data without subscription fees or account minimums presents an attractive entry point for backtesting and strategy development. Understanding the subtle differences—particularly TradeStation's lower reported volume versus the high price consistency across all three (with Alpaca and Polygon.io being nearly identical)—allows traders to make informed decisions tailored to their specific needs and strategy types.

